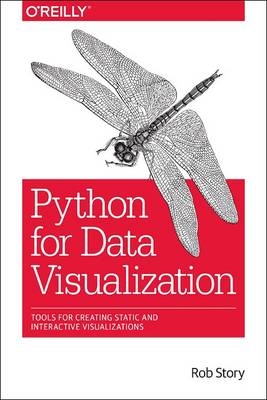
Python for Data Visualization
Seiten
2015
O'Reilly Media (Verlag)
978-1-4919-2515-7 (ISBN)
O'Reilly Media (Verlag)
978-1-4919-2515-7 (ISBN)
- Titel wird leider nicht erscheinen
- Artikel merken
With this practical guide, you'll explore topics from the tools best used to create custom, complex figures for journal publishing to the best quick-and-dirty way to generate web analytics dashboards with D3 and Python.
Learn how to build compelling data analyses and visualizations by leveraging the best open-source Python libraries. With this practical guide, you ll explore topics from the tools best used to create custom, complex figures for journal publishing to the best quick-and-dirty way to generate web analytics dashboards with D3 and Python.In the process, you ll learn the steps necessary to get the data in the right form to be visualized, from importing to cleaning to reshaping whether you re working with CSV or databases. Each chapter begins with a single dataset, and gradually tells the story of each data dimension as you perform exploratory, interactive visualization. The result could be an IPython notebook, a map, or an interactive web page, with data topics ranging from political analysis to business intelligence.By the end of this book, you ll have a complete data visualization tool belt for applying the right visualization to any problem domain, using all of the data structures native to Python."
Learn how to build compelling data analyses and visualizations by leveraging the best open-source Python libraries. With this practical guide, you ll explore topics from the tools best used to create custom, complex figures for journal publishing to the best quick-and-dirty way to generate web analytics dashboards with D3 and Python.In the process, you ll learn the steps necessary to get the data in the right form to be visualized, from importing to cleaning to reshaping whether you re working with CSV or databases. Each chapter begins with a single dataset, and gradually tells the story of each data dimension as you perform exploratory, interactive visualization. The result could be an IPython notebook, a map, or an interactive web page, with data topics ranging from political analysis to business intelligence.By the end of this book, you ll have a complete data visualization tool belt for applying the right visualization to any problem domain, using all of the data structures native to Python."
Rob is a Data Engineer at Simple Finance and author of a number of Python data visualization and analysis packages. Coming from an Ocean and Aerospace Engineering background, he spent time as a Naval Architect performing work for the Office of Naval Research, as a Siting and Loads Engineer for Vestas Wind Power, and as a Software Engineer at DataPad. He currently lives in Portland, OR and tries to escape to the mountains as often as possible.
| Verlagsort | Sebastopol |
|---|---|
| Sprache | englisch |
| Maße | 150 x 250 mm |
| Gewicht | 666 g |
| Themenwelt | Informatik ► Programmiersprachen / -werkzeuge ► Python |
| Mathematik / Informatik ► Informatik ► Theorie / Studium | |
| Mathematik / Informatik ► Informatik ► Web / Internet | |
| ISBN-10 | 1-4919-2515-9 / 1491925159 |
| ISBN-13 | 978-1-4919-2515-7 / 9781491925157 |
| Zustand | Neuware |
| Informationen gemäß Produktsicherheitsverordnung (GPSR) | |
| Haben Sie eine Frage zum Produkt? |
Mehr entdecken
aus dem Bereich
aus dem Bereich
Grundlagen und Praxis der Python-Programmierung
Buch | Softcover (2024)
O'Reilly (Verlag)
CHF 69,85


