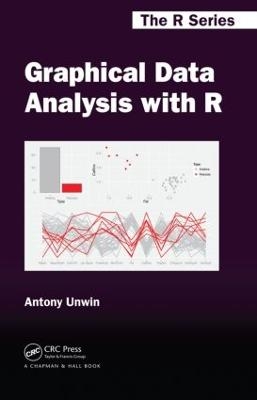
Graphical Data Analysis with R
Chapman & Hall/CRC (Verlag)
978-1-4987-1523-2 (ISBN)
Graphical Data Analysis with R shows you what information you can gain from graphical displays. The book focuses on why you draw graphics to display data and which graphics to draw (and uses R to do so). All the datasets are available in R or one of its packages and the R code is available at rosuda.org/GDA.
Graphical data analysis is useful for data cleaning, exploring data structure, detecting outliers and unusual groups, identifying trends and clusters, spotting local patterns, evaluating modelling output, and presenting results. This book guides you in choosing graphics and understanding what information you can glean from them. It can be used as a primary text in a graphical data analysis course or as a supplement in a statistics course. Colour graphics are used throughout.
Antony Unwin is a professor of computer-oriented statistics and data analysis at the University of Augsburg. He is a fellow of the American Statistical Society, co-author of Graphics of Large Datasets, and co-editor of the Handbook of Data Visualization. His research focuses on data visualisation, especially in interactive graphics. His research group has developed several pieces of interactive graphics software and written packages for R.
Setting the Scene. Brief Review of the Literature and Background Materials. Examining Continuous Variables. Displaying Categorical Data. Looking for Structure: Dependency Relationships and Associations. Investigating Multivariate Continuous Data. Studying Multivariate Categorical Data. Getting an Overview. Graphics and Data Quality: How Good Are the Data?. Comparisons, Comparisons, Comparisons. Graphics for Time Series. Ensemble Graphics and Case Studies. Some Notes on Graphics with R. Summary. References. Indices.
| Reihe/Serie | Chapman & Hall/CRC The R Series |
|---|---|
| Zusatzinfo | 2 Tables, black and white; 135 Illustrations, color |
| Sprache | englisch |
| Maße | 156 x 234 mm |
| Gewicht | 650 g |
| Themenwelt | Geisteswissenschaften ► Psychologie ► Allgemeine Psychologie |
| Informatik ► Datenbanken ► Data Warehouse / Data Mining | |
| Mathematik / Informatik ► Mathematik | |
| ISBN-10 | 1-4987-1523-0 / 1498715230 |
| ISBN-13 | 978-1-4987-1523-2 / 9781498715232 |
| Zustand | Neuware |
| Informationen gemäß Produktsicherheitsverordnung (GPSR) | |
| Haben Sie eine Frage zum Produkt? |
aus dem Bereich


