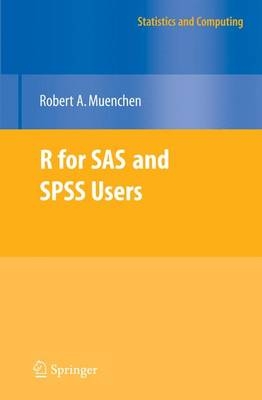
R for SAS and SPSS Users
Seiten
2010
|
2009 ed.
Springer-Verlag New York Inc.
978-1-4419-1854-3 (ISBN)
Springer-Verlag New York Inc.
978-1-4419-1854-3 (ISBN)
- Titel erscheint in neuer Auflage
- Artikel merken
Zu diesem Artikel existiert eine Nachauflage
This book introduces R using SAS and SPSS terms. It demonstrates which of the add-on packages are most like SAS and SPSS and compares them to R's built-in functions. It compares and contrasts the differing approaches of all three packages.
R is a powerful and free software system for data analysis and graphics, with over 1,200 add-on packages available. This book introduces R using SAS and SPSS terms with which you are already familiar. It demonstrates which of the add-on packages are most like SAS and SPSS and compares them to R's built-in functions. It steps through over 30 programs written in all three packages, comparing and contrasting the packages' differing approaches. The programs and practice datasets are available for download. The glossary defines over 50 R terms using SAS/SPSS jargon and again using R jargon. The table of contents and the index allow you to find equivalent R functions by looking up both SAS statements and SPSS commands. When finished, you will be able to import data, manage and transform it, create publication quality graphics, and perform basic statistical analyses. "This is a really great book. It is easy to read, quite comprehensive, and would be extremely valuable to both regular R users and users of SAS and SPSS who wish to switch to or learn about R!An invaluable reference."
- David Hitchcock, University of South Carolina "Thanks for writing R for SAS and SPSS Users--it is a comprehensible and clever document. The graphics chapter is superb!" - Tony N. Brown, Vanderbilt University "This is a Rosetta Stone for SPSS and SAS users to start learning R quickly and effectively." - Ralph O'Brien, ASA Fellow "I am a professional SAS and SPSS programmer and found this book extremely useful." - Tony Chu, Public Policy Research Data Analyst
Introduction. The five main parts of SAS and SPSS.- Programming conventions.- Typographic conventions.- Installing & updating R.- Running R.- Help and documentation.- Programming language basics.- Data Acquisition.- Selecting Variables - Var, Variables=.- Selecting observations - where, if select if, filter.- Selecting both variables and observations.- Converting data structures.- Data management.- Recoding variables. Value labels or formats (& measurement level).- Variable labels.- Generating data.- How R stores data.- Managing your files and workspace.- Graphics overview.- Traditional graphics.- The ggplot2 package.- Statistics.- Summary.- Conclusion.- Appendix A.- Appendix B.- Appendix C.- Bibliography.
| Erscheint lt. Verlag | 10.12.2010 |
|---|---|
| Reihe/Serie | Statistics and Computing |
| Verlagsort | New York, NY |
| Sprache | englisch |
| Einbandart | Paperback |
| Themenwelt | Geisteswissenschaften ► Psychologie |
| Informatik ► Datenbanken ► Data Warehouse / Data Mining | |
| Mathematik / Informatik ► Informatik ► Grafik / Design | |
| Mathematik / Informatik ► Informatik ► Theorie / Studium | |
| Mathematik / Informatik ► Mathematik ► Computerprogramme / Computeralgebra | |
| Mathematik / Informatik ► Mathematik ► Wahrscheinlichkeit / Kombinatorik | |
| Sozialwissenschaften ► Soziologie | |
| ISBN-10 | 1-4419-1854-X / 144191854X |
| ISBN-13 | 978-1-4419-1854-3 / 9781441918543 |
| Zustand | Neuware |
| Informationen gemäß Produktsicherheitsverordnung (GPSR) | |
| Haben Sie eine Frage zum Produkt? |
Mehr entdecken
aus dem Bereich
aus dem Bereich
Ein verständlicher Einstieg mit Python
Buch | Softcover (2024)
O'Reilly (Verlag)
CHF 41,85
Auswertung von Daten mit pandas, NumPy und IPython
Buch | Softcover (2023)
O'Reilly (Verlag)
CHF 62,85


