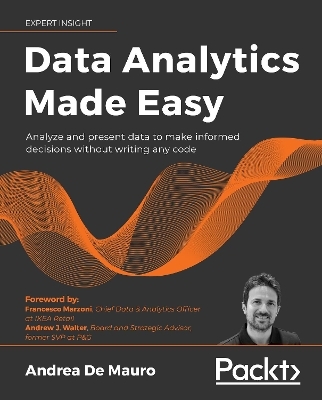
Data Analytics Made Easy
Packt Publishing Limited (Verlag)
978-1-80107-415-5 (ISBN)
Learn how to gain insights from your data as well as machine learning and become a presentation pro who can create interactive dashboards
Key Features
Enhance your presentation skills by implementing engaging data storytelling and visualization techniques
Learn the basics of machine learning and easily apply machine learning models to your data
Improve productivity by automating your data processes
Book DescriptionData Analytics Made Easy is an accessible beginner’s guide for anyone working with data. The book interweaves four key elements:
Data visualizations and storytelling – Tired of people not listening to you and ignoring your results? Don’t worry; chapters 7 and 8 show you how to enhance your presentations and engage with your managers and co-workers. Learn to create focused content with a well-structured story behind it to captivate your audience.
Automating your data workflows – Improve your productivity by automating your data analysis. This book introduces you to the open-source platform, KNIME Analytics Platform. You’ll see how to use this no-code and free-to-use software to create a KNIME workflow of your data processes just by clicking and dragging components.
Machine learning – Data Analytics Made Easy describes popular machine learning approaches in a simplified and visual way before implementing these machine learning models using KNIME. You’ll not only be able to understand data scientists’ machine learning models; you’ll be able to challenge them and build your own.
Creating interactive dashboards – Follow the book’s simple methodology to create professional-looking dashboards using Microsoft Power BI, giving users the capability to slice and dice data and drill down into the results.
What you will learn
Understand the potential of data and its impact on your business
Import, clean, transform, combine data feeds, and automate your processes
Influence business decisions by learning to create engaging presentations
Build real-world models to improve profitability, create customer segmentation, automate and improve data reporting, and more
Create professional-looking and business-centric visuals and dashboards
Open the lid on the black box of AI and learn about and implement supervised and unsupervised machine learning models
Who this book is forThis book is for beginners who work with data and those who need to know how to interpret their business/customer data. The book also covers the high-level concepts of data workflows, machine learning, data storytelling, and visualizations, which are useful for managers.
No previous math, statistics, or computer science knowledge is required.
Andrea De Mauro has more than 15 years of international experience managing Data Analytics and Data Science organizations. He is currently Head of Business Intelligence at Vodafone Italy. Previously, he served as Director of Business Analytics at Procter & Gamble, looking after the continuous elevation of data analytics in the business and the development of digital fluency across the global organization. He is a professor of Marketing Analytics and Applied Machine Learning at the International University in Geneva, Switzerland, and at the Universities of Bari and Florence, Italy. In his research, he investigates the essential components of Big Data as a phenomenon and the impact of AI and Data Analytics on companies and people. He is the author of popular science books on data analytics and research papers in international journals.
Table of Contents
What is Data Analytics?
Getting Started with KNIME
Transforming Data
What is Machine Learning?
Applying Machine Learning at Work
Getting Started with Power BI
Visualizing Data Effectively
Telling Stories with Data
Extending Your Toolbox
| Erscheinungsdatum | 06.09.2021 |
|---|---|
| Vorwort | Francesco Marzoni, Andrew J. Walter |
| Verlagsort | Birmingham |
| Sprache | englisch |
| Maße | 75 x 93 mm |
| Themenwelt | Informatik ► Datenbanken ► Data Warehouse / Data Mining |
| Mathematik / Informatik ► Informatik ► Programmiersprachen / -werkzeuge | |
| Mathematik / Informatik ► Mathematik | |
| Wirtschaft ► Volkswirtschaftslehre ► Ökonometrie | |
| ISBN-10 | 1-80107-415-1 / 1801074151 |
| ISBN-13 | 978-1-80107-415-5 / 9781801074155 |
| Zustand | Neuware |
| Informationen gemäß Produktsicherheitsverordnung (GPSR) | |
| Haben Sie eine Frage zum Produkt? |
aus dem Bereich


