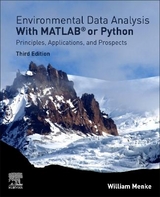
Environmental Data Analysis with MatLab
Academic Press Inc (Verlag)
978-0-12-804488-9 (ISBN)
- Titel erscheint in neuer Auflage
- Artikel merken
MATLAB®, a commercial data processing environment, is used in these scenarios. Significant content is devoted to teaching how it can be effectively used in an environmental data analysis setting. This new edition, though written in a self-contained way, is supplemented with data and MATLAB® scripts that can be used as a data analysis tutorial.
New features include boxed crib sheets to help identify major results and important formulas and give brief advice on how and when they should be used. Numerical derivatives and integrals are derived and illustrated. Includes log-log plots with further examples of their use. Discusses new datasets on precipitation and stream flow. Topical enhancement applies the chi-squared test to the results of the generalized least squares method. New coverage of cluster analysis and approximation techniques that are widely applied in data analysis, including Taylor Series and low-order polynomial approximations; non-linear least-squares with Newton’s method; and pre-calculation and updating techniques applicable to real time data acquisition.
William Menke is a Professor of Earth and Environmental Sciences at Columbia University. His research focuses on the development of data analysis algorithms for time series analysis and imaging in the earth and environmental sciences and the application of these methods to volcanoes, earthquakes, and other natural hazards. He has thirty years of experience teaching data analysis methods to both undergraduates and graduate students. Relevant courses that he has taught include, at the undergraduate level, Environmental Data Analysis and The Earth System, and at the graduate level, Geophysical Inverse Theory, Quantitative Methods of Data Analysis, Geophysical Theory and Practical Seismology. Joshua Menke is a software engineer and principal of JOM Associates. His specialty is in the design and implementation of parallel processing systems for matching and correlation of large volumes of data in order to identify and quantify trends and patterns that can assist manufacturers and retailer better serve their clientele.
1. Data analysis with MatLab2. A first look at data3. Probability and what it has to do with data analysiz4. The power of linear models5. Quantifying preconceptions6. Detecting periodicities7. The past influences the present8. Patterns suggested by data9. Detecting correlations among data10. Filling in missing data11. "Approximate" is not a pejorative word12. Are my results significant?13. Notes
| Erscheinungsdatum | 16.03.2016 |
|---|---|
| Verlagsort | San Diego |
| Sprache | englisch |
| Maße | 191 x 235 mm |
| Gewicht | 720 g |
| Themenwelt | Mathematik / Informatik ► Mathematik ► Wahrscheinlichkeit / Kombinatorik |
| Naturwissenschaften ► Biologie ► Ökologie / Naturschutz | |
| Technik ► Umwelttechnik / Biotechnologie | |
| ISBN-10 | 0-12-804488-8 / 0128044888 |
| ISBN-13 | 978-0-12-804488-9 / 9780128044889 |
| Zustand | Neuware |
| Informationen gemäß Produktsicherheitsverordnung (GPSR) | |
| Haben Sie eine Frage zum Produkt? |
aus dem Bereich


