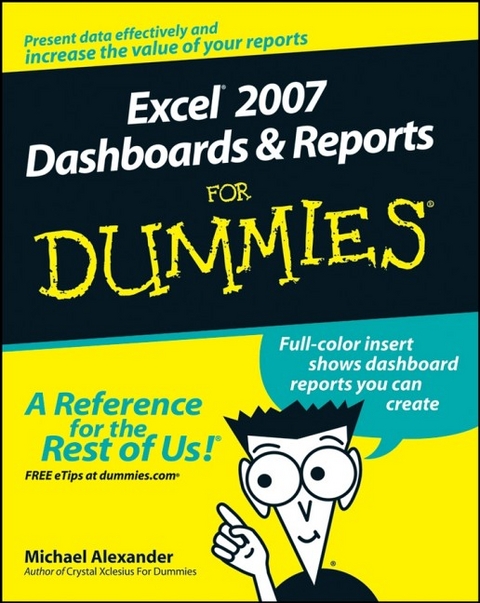
Excel 2007 Dashboards and Reports For Dummies
John Wiley & Sons Ltd (Verlag)
978-0-470-22814-2 (ISBN)
- Titel ist leider vergriffen;
keine Neuauflage - Artikel merken
Discover how to: Unleash the power of Excel as a business intelligence tool Create dashboards that communicate and get noticed Think about your data in a new way Present data more effectively and increase the value of your reports Create dynamic labels that support visualization Represent time and seasonal trending Group and bucket data Display and measure values versus goals Implement macro-charged reporting Using Excel 2007 as a BI tool is the most cost-efficient way for organizations of any size create powerful and insightful reports and distribute throughout the enterprise. And Excel 2007 Dashboards and Reports for Dummies is the fastest you for you to catch dashboard fever!
Michael Alexander is a Microsoft Certified Application Developer (MCAD) with over 14 years experience consulting and developing office solutions. He is the author/co-author of several books on business analysis using Microsoft Excel and Access. Michael is one of 96 Microsoft Excel MVPs worldwide who has been recognized for his contributions to the Excel community. He is also the principal player behind DataPigTechnologies.com, a site that offers video tutorials to beginning and intermediate Excel and Access users. He currently lives in Frisco, Texas where he works as a Senior Program Manager for a top technology firm. Michael can be contacted at mike@datapigtechnologies.com.
Introduction. Part I: Making the Move to Dashboards. Chapter 1: Getting in the Dashboard State of Mind. Chapter 2: Building a Super Model. Part II: Building Basic Dashboard Components. Chapter 3: The Pivotal Pivot Table. Chapter 4: Excel Charts for the Uninitiated. Chapter 5: The New World of Conditional Formatting. Chapter 6: The Art of Dynamic Labeling. Part III: Building Advanced Dashboard Components. Chapter 7: Components That Show Trending. Chapter 8: Components That Group and Bucket Data. Chapter 9: Components That Display Performance against a Target. Part IV: Advanced Reporting Techniques. Chapter 10: Macro-Charged Reporting. Chapter 11: Giving Users an Interactive Interface. Part V: Working with the Outside World. Chapter 12: Using External Data for Your Dashboards and Reports. Chapter 13: Sharing Your Work with the Outside World. Part VI: The Part of Tens. Chapter 14: Ten Chart Design Principles. Chapter 15: Ten Questions to Ask Before Distributing Your Dashboard. Index.
| Zusatzinfo | Illustrations (some col.) |
|---|---|
| Verlagsort | Chichester |
| Sprache | englisch |
| Maße | 189 x 235 mm |
| Gewicht | 534 g |
| Themenwelt | Informatik ► Office Programme ► Excel |
| Schlagworte | Excel 2007; Einführung |
| ISBN-10 | 0-470-22814-8 / 0470228148 |
| ISBN-13 | 978-0-470-22814-2 / 9780470228142 |
| Zustand | Neuware |
| Informationen gemäß Produktsicherheitsverordnung (GPSR) | |
| Haben Sie eine Frage zum Produkt? |
aus dem Bereich


