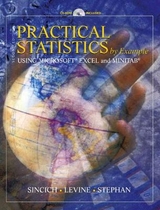
Practical Statistics by Example Using Microsoft Excel
Pearson (Verlag)
978-0-13-096083-2 (ISBN)
- Titel ist leider vergriffen;
keine Neuauflage - Artikel merken
A practical introduction to statistics that fully incorporates Microsoft Excel as the computational tool for data analysis. Concepts are introduced through real-data based examples with fully worked out solutions. Problems in the exercise sets are graded in level from "Using the Tools" to "Applying the Concepts." Self-test questions appear immediately after important ideas have been introduced to test the student's comprehension of the concepts and to help develop good study habits. Full instruction on using Microsoft Excel is incorporated into the text by means of: a primer on using Windows and Microsoft Excel for the novice, Excel Tutorials with step-by-step instructions and multiple screen shots at the end of each chapter, exercises keyed to data sets contained in Excel Workbooks, and the Prentice Hall Excel add-in disk (packaged free with each copy of the book) that extends the capacity of off-the-shelf Excel and presents many more statistical techniques and procedures through a few simple menus.
Microsoft Excel Primer. Part 1: Getting Started with the User Interface. Getting Familiar with Mouse Operations. Getting Familiar with the Microsoft Excel Application Window. Getting Familiar with Menu Conventions and Dialog Boxes. Part 2: Getting Started with Microsoft Excel. Configuring Microsoft Excel. Specifying Worksheet Locations. Using Formulas to Perform Calculations. Entering Data into Worksheets. Copying Cell Entries and Worksheets. Opening Workbooks. Printing Worksheets. Saving Workbooks. Enhancing the Appearance of a Worksheet. Getting Context-Sensitive Help in Microsoft Excel. Part 3: Getting Started with Microsoft Excel Wizards and Add-Ins. Wizards. Using Add-Ins. Summary. 1. Introduction: Statistics and Data. What Is Statistics? Types of Data. Descriptive vs. Inferential Statistics. Collecting Data. Random Sampling. Other Types of Samples (Optional). Ethical and Other Concerns in Statistical Applications. Excel Tutorial. 2. Exploring Data with Graphs and Tables. The Objective of Data Description. Describing a Single Qualitative Variable: Frequency Tables, Bar Graphs, and Pie Charts. Describing a Single Quantitative Variable: Frequency Tables, Stem-leaf Displays, and Histograms. Exploring the Relationship Between Two Qualitative Variables: Cross-Classification Tables and Side-by-Side Graphs. Exploring the Relationship Between Two Quantitative Variables: Scatterplots. Proper Graphical Presentation. Excel Tutorials. 3. Exploring Quantitative Data with Numerical Descriptive Measures. Types of Numerical Descriptive Measures. Summation Notation. Measures of Central Tendency: Mean, Median, and Mode. Measures of Data Variation: Range, Variance, and Standard Deviation. Interpreting the Standard Deviation. Measures of Relative Standing: Percentiles and z-scores. Box-and-Whisker Plots. A Measure of Association: Correlation. Numerical Descriptive Measures for Populations. Excel Tutorials. 4. Probability: Basic Concepts. The Role of Probability in Statistics. Experiments, Events, and the Probability of an Event. Probability Rules for Mutually Exclusive Events. The Combinatorial Rule for Counting Simple Events (Optional). Conditional Probability and Independence. The Additive and Multiplicative Laws of Probability (Optional). Excel Tutorial. 5. Discrete Probability Distributions. Random Variables. Probability Models for Discrete Random Variables. The Binomial Probability Distribution. The Poisson Probability Distribution. The Hypergeometric Probability Distribution (Optional). Excel Tutorials. 6. Normal Probability Distributions. Probability Models for Continuous Random Variables. The Normal Distribution. Descriptive Methods for Assessing Normality: Sampling Distributions. The Sampling Distribution of the Sample Mean and the Central Limit Theorem. Excel Tutorials. 7. Estimation of Population Parameters using Confidence Intervals: One Sample. Point Estimators. Estimation of a Population Mean: Normal (z) Statistic. Estimation of a Population Mean: :Students (t) Statistic. Estimation of a Population Proportion. Choosing the Sample Size. Estimation of a Population Variance (Optional). Excel Tutorials. 8. Testing Hypotheses About Population Parameters: One Sample. The Relationship Between Hypothesis Tests and Confidence Intervals. Hypothesis-Testing Methodology: Formulating Hypotheses. Hypothesis-Testing Methodology: Test Statistics and Rejection Regions. Guidelines for Determining the Target Parameter. Testing a Population Mean. Reporting Test Results: p-Values. Testing a Population Proportion. Testing a Population Variance (Optional). Potential Hypothesis Testing Pitfalls and Ethical Issues. Excel Tutorial. 9. Inferences About Population Parameters: Two Samples. Determining the Target Parameter. Comparing Two Population Means: Independent Samples. Comparing Two Population Means: Matched Pairs. Comparing Two Population Proportions: Independent Samples. Comparing Population Proportions: Contingency Tables. Comparing Two Population Variances (Optional). Excel Tutorials. 10. Regression Analysis. Introduction to Regression Models. The Straight-Line Model: Simple Linear Regression. Estimating and Interpreting the Model Parameters. Model Assumptions. Measuring Variability around the Least Square Line. Inferences About the Slope. The Coefficient of Determination. Using the Model for Estimation and Prediction. Computations in Simple Linear Regression. Residual Analysis: Checking the Assumptions (Optional). Multiple Regression Models (Optional). Pitfalls in Regression and Ethical Issues (Optional). Excel Tutorials. 11. Analysis of Variance. Experimental Design. ANOVA Fundamentals. Completely Randomized Designs: One-Way ANOVA. Factorial Designs: Two-Way ANOVA. Follow-Up Analysis: Multiple Comparisons of Means. Checking ANOVA Assumptions. Calculation Formulas for ANOVA (Optional). Excel Tutorials. 12. Nonparametric Statistics. Distribution-Free Tests. Tests for Location of a Single Population. Comparing Two Populations: Independent Random Samples. Comparing Two Populations: Matched-Pairs Design. Comparing Three or More Populations: Completely Randomized Design. Testing for Rank Correlation. Excel Tutorials. Appendix A: Review of Arithmetic and Algebra. Appendix B: Statistical Tables. Appendix C: Documentation for Microsoft Excel Diskette Files. Appendix D: Installation Instructions for the PHStat Add-In for Microsoft Excel and the Data Files on the CD-ROM. Answers to Self-Test Problems. Answers to Selected Problems. References. Excel Index. Subject Index.
| Erscheint lt. Verlag | 1.3.1999 |
|---|---|
| Sprache | englisch |
| Maße | 210 x 262 mm |
| Gewicht | 1733 g |
| Themenwelt | Informatik ► Office Programme ► Excel |
| Mathematik / Informatik ► Mathematik ► Statistik | |
| ISBN-10 | 0-13-096083-7 / 0130960837 |
| ISBN-13 | 978-0-13-096083-2 / 9780130960832 |
| Zustand | Neuware |
| Informationen gemäß Produktsicherheitsverordnung (GPSR) | |
| Haben Sie eine Frage zum Produkt? |
aus dem Bereich


