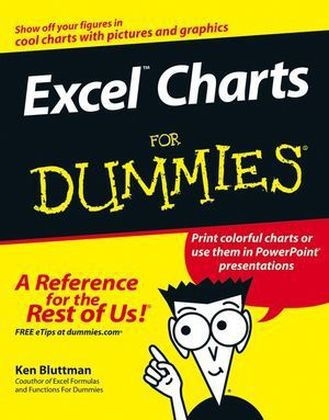
Excel Charts For Dummies
Hungry Minds Inc,U.S. (Verlag)
978-0-7645-8473-2 (ISBN)
- Titel ist leider vergriffen;
keine Neuauflage - Artikel merken
Veteran author John Nicholson shows Excel users how to display data in presentation--quality charts that are clear and easy to understand Packed with real--world examples, this book covers the entire range of charts--including pies, scatter plots, and PivotCharts--in step--by--step tutorials Explains how to embed graphics and pictures into charts and then use them in PowerPoint presentations or Microsoft Word documents Addresses how to use charts for statistical analysis and also discusses how charts can sometimes skew data ...and even deceive A 16--page color insert showcases cutting--edge example charts
Ken Bluttman has been working as a software developer for over 15 years. He works with many technologies, including Office/VBA, Visual Basic .NET, SQL Server, as well as ASP.NET and other Web goodies. He is the author of Excel Formulas and Functions For Dummies, Access Hacks, and Developing Microsoft Office Solutions.
Introduction. Part I: Getting Started with Excel Charts. Chapter 1: Harnessing the Power of Excel Charts. Chapter 2: Understanding How Charts Are Constructed. Chapter 3: Making Great Charts with the Chart Wizard. Part II: Exploring Chart Types. Chapter 4: Creating Charts That Compare Items. Chapter 5: Creating Charts That Show Change. Chapter 6: Creating Charts That Display Data Relationships. Chapter 7: Working With Custom Chart Types. Part III: Formatting Charts. Chapter 8: Positioning and Sizing Your Charts. Chapter 9: Formatting the Chart Area, Plot Area, and Gridlines. Chapter 10: Formatting the Axes' Patterns, Font, Number Format, and Alignment. Chapter 11: Working With the Category--Axis Scale Settings. Chapter 12: Working With the Value--Axis Scale Settings. Chapter 13: Formatting the Data Series. Chapter 14: Working With 3--D Views. Chapter 15: Using AutoShapes and Graphics. Part IV: Advanced Chart Techniques. Chapter 16: Adding Trendlines to a Chart. Chapter 17: Using Combination Charts. Chapter 18: Creating and Saving User--Defined Charts. Chapter 19: Creating Pivot Tables and Pivot Charts. Chapter 20: Interacting with External Programs. Part V: The Part of Tens. Chapter 21: Ten Chart Remakes. Chapter 22: Ten (or So) Fancy Charts. Index.
| Erscheint lt. Verlag | 10.6.2005 |
|---|---|
| Zusatzinfo | Illustrations |
| Verlagsort | Foster City |
| Sprache | englisch |
| Maße | 186 x 232 mm |
| Gewicht | 648 g |
| Einbandart | Paperback |
| Themenwelt | Mathematik / Informatik ► Informatik ► Datenbanken |
| Informatik ► Office Programme ► Excel | |
| ISBN-10 | 0-7645-8473-1 / 0764584731 |
| ISBN-13 | 978-0-7645-8473-2 / 9780764584732 |
| Zustand | Neuware |
| Informationen gemäß Produktsicherheitsverordnung (GPSR) | |
| Haben Sie eine Frage zum Produkt? |
aus dem Bereich


