Visual Analysis of Multilayer Networks
Morgan & Claypool Publishers (Verlag)
978-1-63639-145-8 (ISBN)
- Lieferbar
- Versandkostenfrei
- Auch auf Rechnung
- Artikel merken
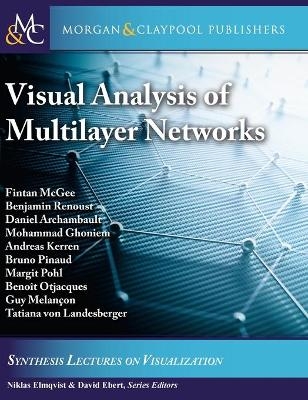
The emergence of multilayer networks as a concept from the field of complex systems provides many new opportunities for the visualization of network complexity, and has also raised many new exciting challenges. The multilayer network model recognizes that the complexity of relationships between entities in real-world systems is better embraced as several interdependent subsystems (or layers) rather than a simple graph approach. Despite only recently being formalized and defined, this model can be applied to problems in the domains of life sciences, sociology, digital humanities, and more. Within the domain of network visualization there already are many existing systems, which visualize data sets having many characteristics of multilayer networks, and many techniques, which are applicable to their visualization. In this Synthesis Lecture, we provide an overview and structured analysis of contemporary multilayer network visualization. This is not only for researchers in visualization, but also for those who aim to visualize multilayer networks in the domain of complex systems, as well as those solving problems within application domains. We have explored the visualization literature to survey visualization techniques suitable for multilayer network visualization, as well as tools, tasks, and analytic techniques from within application domains. We also identify the research opportunities and examine outstanding challenges for multilayer network visualization along with potential solutions and future research directions for addressing them.
Dr. Fintan McGee is a research associate at the Luxembourg Institute of Science and Technology (LIST). He received his Ph.D. in Computer Science from Trinity College Dublin, in 2013. He was an organizer of the Dagstuhl Seminar on "Visual Analytics of Multilayer Networks across Disciplines" (#19061) as well as the Multilayer Network visualization workshop at VIS 2019. He was work package leader on the BLIZAAR project, an international collaboration, that focuses on multilayer network visualization. His research focuses on visualization of biological data (a key application domain for multilayer network visualization), including multivariate analytics, as well as visualization evaluation. Dr. Benjamin Renoust is a guest associate professor at the Osaka University, Institute for Datability Science since 2017, and senior data scientist at Median Technologies since 2019. He is also a visiting lecturer at the National Institute of Informatics (NII), and at the CNRS UMI 3527 Japanese–French Laboratory for Informatics (JFLI), Japan (since 2014). He was a research engineer at the National Audiovisual Institute (Ina) in Paris, France, from 2009–2012, and received his Ph.D. in 2014 from the University of Bordeaux, France (with a Ph.D. thesis dedicated to the visualization and analysis of multiplex networks). He cofounded in 2019 the French chapter of the Complex System Society. His research is focused on network visual analytics and media analytics, with applications in a large variety of domains ranging from humanities and medical imagery, to law and quantum physics. Benjamin especially uses multilayer networks to interact with the heterogeneity of data in each of these domains. Dr. Daniel Archambault received his Ph.D. in Computer Science from the University of British Columbia, Canada in 2008. He is an Associate Professor of Computer Science at Swansea University in the United Kingdom. His principle area of research is the scalable interactive visualization of networks in both static and dynamic settings. He also has interests in many areas of information visualization, visual analytics, text analysis and visualization, social media analytics, visual data science, and perceptual factors in visualization. Dr. Mohammad Ghoniem is a senior research and technology associate at the Luxembourg Institute of Science and Technology. He received his doctorate in Computer Science from the University of Nantes, France, in 2005. His main research interests include information visualization, visual analytics, and usability evaluation of information visualization. Over the past decade, Dr. Ghoniem has been involved, including as a PI, in multiple research projects at the intersection of information visualization and various application domains such as financial fraud detection, retail analytics, broadcast media analytics, metagenomics and network security. He was the Luxembourg-based PI for the BLIZAAR international collaborative research project, dedicated to the visualization of multilayer networks (2016–2019). Prof. Dr. Andreas Kerren received his Ph.D. degree in Computer Science from Saarland University, Saarbrücken (Germany). In 2008, he achieved his habilitation (docent competence) from Växjö University. Dr. Kerren joined Linköping University as a Full Professor in 2020 and holds the chair of Information Visualization. He is also a Full Professor (part time) in Computer Science at the Department of Computer Science and Media Technology, Linnaeus University, where he heads the research group for Information and Software Visualization, called ISOVIS. His main research interests include the areas of Information Visualization, Visual Analytics, and Human-Computer Interaction. He is, among others, an editorial board member of the Information Visualization and Computer Graphics Forum journals, has served as organizer/program chair at various conferences, such as IEEE VISSOFT 2013/2018, GD 2018, or IVAPP 2013–15/2018–20, and has edited a number of successful books on human-centered visualization. Dr. Bruno Pinaud received his Ph.D. in Computer Science at University of Nantes, France in 2006. Since 2008, he is an associate professor in Computer Science at University of Bordeaux, France. He received his habilitation (HDR in French) in October 2019. His work has focused on visual analytics, graph rewriting systems modeling and visualization, and experimental evaluation. He was the French PI on the BLIZAAR project, an international collaboration, that focuses on multilayer network visualization between researchers from France and Luxembourg. He is a co-author of a recent survey on multilayer network visualization published in Computer Graphics Forum. Bruno Pinaud is also an active developer of the Tulip information visualization framework. Dr. Margit Pohl received her Master's degree in Computer Science at University of Vienna in 1989 and her Ph.D. in Psychology in 1994 at University of Vienna. She received her habilitation at Vienna University of Technology in 2002. Since 2001 she has been an associate professor at Vienna University of Technology. Her main research interests are HCI and visualization, visual analytics, and cognitive psychology. In this context, she has especially addressed issues of reasoning with complex visualizations. She has published extensively on the appropriate design of complex visualizations. She has co-organized several workshops and tutorials in the area (e.g., EuroVA Symposium, tutorial on comparative visualization at VIS 2018). Dr. Ir. Benoît Otjacques leads the Data Science and Analytics Unit of LIST focused on data analytics, visualization, and interactive technologies. He has been working in visualization for more than 15 years. Beside his research work, he has also been leading various projects involving private companies and public administration. He holds a Ph.D. in Computer Science from the University of Namur (Belgium), an Engineering degree from Ecole Polytechnique de Louvain (Belgium), as well as a University Certificate in Business Ethics and Compliance Management from Louvain School of Management. He has served as organizer/chair of several conferences, like CDVE 2009, EMISA 2014, EGC 2015, and EnviroInfo 2017. Prof. Guy Melançon's primary research area is network visual analytics, focusing specifically on multilayer and dynamic networks, with extensive experience in multi-disciplinary research projects. The application domains of his work have included human trafficking networks, digital ethnography, historical archives, spatial geography, and software engineering. He was an organizer of the recent Dagstuhl Seminar on "Visual Analytics of Multilayer Networks across Disciplines" (#19061), keynote speaker at the multilayer network visualization workshop at VIS 2019, and has recently been made a vice-president at the University of Bordeaux. Prof. Tatiana von Landesberger is the professor of visualization and Visual Analytics at University of Cologne, Germany previously she has been a professor of Visual Analytics at Universität Rostock, Germany. Her research focuses on visual analytics of networks and spatio-temporal data. She has experience with visual exploration of multilayer networks in the journalism domain as well as network visualization in biology, finance, and medicine. She serves on program committees of visualization research conferences. She was an organizer of the recent Dagstuhl Seminar on "Visual Analytics of Multilayer Networks across Disciplines" (#19061). She has been involved in the organization of several visualization workshops (e.g., VMV, EuroVA, as well as the Multilayer Network visualization workshop at VIS 2019), panel, and tutorials (e.g., at VIS 2014 and 2018).
Preface
Figure Credits
Introduction and Overview
Multilayer Networks Across Domains
The Layer as an Entity
Task Taxonomy for Multilayer Networks
Visualization of Nodes and Relationships Across Layers
Interacting with and Analyzing Multilayer Networks
Attribute Visualization and Multilayer Networks
Evaluation of Multilayer Network Visualization Systems and Techniques
Conclusions
Bibliography
Authors' Biographies
List of Figures
| Erscheinungsdatum | 05.03.2022 |
|---|---|
| Reihe/Serie | Synthesis Lectures on Visualization |
| Verlagsort | San Rafael |
| Sprache | englisch |
| Maße | 191 x 235 mm |
| Gewicht | 333 g |
| Themenwelt | Informatik ► Datenbanken ► Data Warehouse / Data Mining |
| Mathematik / Informatik ► Informatik ► Netzwerke | |
| Informatik ► Software Entwicklung ► User Interfaces (HCI) | |
| ISBN-10 | 1-63639-145-1 / 1636391451 |
| ISBN-13 | 978-1-63639-145-8 / 9781636391458 |
| Zustand | Neuware |
| Haben Sie eine Frage zum Produkt? |
aus dem Bereich


