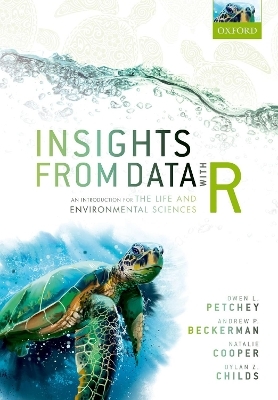
Insights from Data with R
Oxford University Press (Verlag)
978-0-19-884982-7 (ISBN)
Experiments, surveys, measurements, and observations all generate data. These data can provide useful insights for solving problems, guiding decisions, and formulating strategy. Progressing from relatively unprocessed data to insight, and doing so efficiently, reliably, and confidently, does not come easily, and yet gaining insights from data is a fundamental skill for science as well as many other fields and often overlooked in most textbooks of statistics and data analysis.
This accessible and engaging book provides readers with the knowledge, experience, and confidence to work with data and unlock essential information (insights) from data summaries and visualisations. Based on a proven and successful undergraduate course structure, it charts the journey from initial question, through data preparation, import, cleaning, tidying, checking, double-checking, manipulation, and final visualization. These basic skills are sufficient to gain useful insights from data without the need for any statistics; there is enough to learn about even before delving into that world!
The book focuses on gaining insights from data via visualisations and summaries. The journey from raw data to insights is clearly illustrated by means of a comprehensive Workflow Demonstration in the book featuring data collected in a real-life study and applicable to many types of question, study, and data. Along the way, readers discover how to efficiently and intuitively use R, RStudio, and tidyverse software, learning from the detailed descriptions of each step in the instructional journey to progress from the raw data to creating elegant and informative visualisations that reveal answers to the initial questions posed. There are an additional three demonstrations online!
Insights from Data with R is suitable for undergraduate students and their instructors in the life and environmental sciences seeking to harness the power of R, RStudio, and tidyverse software to master the valuable and prerequisite skills of working with and gaining insights from data.
Owen L. Petchey is Professor of Integrative Ecology at the Department of Evolutionary Biology and Environmental Studies, University of Zürich, Switzerland. He has used R for nearly 20 years, and has particular expertise in teaching beginners, multivariate statistics, spatial data, programming, maximum likelihood estimation, and visualisation (i.e., nice graphs!). His research focuses on the causes and consequences of extinctions in a changing world. His group performs experiments with microbial communities, models the structure of food webs, analyses variation in biodiversity, and does fieldwork in Iceland, the UK, and Switzerland. Andrew P. Beckerman is Professor of Evolutionary Ecology at the Department of Animal and Plant Sciences, University of Sheffield, UK. He has used R for nearly 20 years, and has particular expertise in teaching the exploration, visualisation and analysis of simple and complex data. His research focuses on the structure and dynamics of ecological communities facing multiple simultaneous stressors. His group models the structure and dynamics of food webs, analyses trait and population responses to environmental variation, and explores the conservation ecology of endangered species. Natalie Cooper is a Researcher at the Natural History Museum, London, UK, where her research focuses on understanding the evolution of biodiversity. She works on all kinds of organisms, from parasites to blue whales, and does all of her research in R. Dylan Z. Childs is a Senior Lecturer at the University of Sheffield, UK. He has used R for over 15 years and has particular expertise in teaching population modelling and advanced statistical tools such as mixed models. His research focuses on data-driven modelling of populations and communities. His group uses demographic methods to model structured population dynamics, analyses trait and population responses to environmental variation, and develops methods for integrating individual- and population-level data into predictive models.
Preface
1: Introduction
2: Getting acquainted
3: Workflow demonstration Part 1: Preparation
4: Workflow demonstration Part 2: Getting insights
5: Dealing with data 1: Digging into dplyr
6: Dealing with data 2: Expanding your toolkit
7: Getting to grips with ggplot2
8: Making Deeper Insights Part 1: Working with single variables
9: Making Deeper Insights Part 2: Relationships among (many) variables
10: Looking back and looking forward
| Erscheinungsdatum | 19.04.2021 |
|---|---|
| Zusatzinfo | 60 colour line figures and illustrations |
| Verlagsort | Oxford |
| Sprache | englisch |
| Maße | 168 x 240 mm |
| Gewicht | 608 g |
| Themenwelt | Mathematik / Informatik ► Informatik ► Software Entwicklung |
| Mathematik / Informatik ► Mathematik ► Computerprogramme / Computeralgebra | |
| Naturwissenschaften | |
| ISBN-10 | 0-19-884982-6 / 0198849826 |
| ISBN-13 | 978-0-19-884982-7 / 9780198849827 |
| Zustand | Neuware |
| Informationen gemäß Produktsicherheitsverordnung (GPSR) | |
| Haben Sie eine Frage zum Produkt? |
aus dem Bereich


