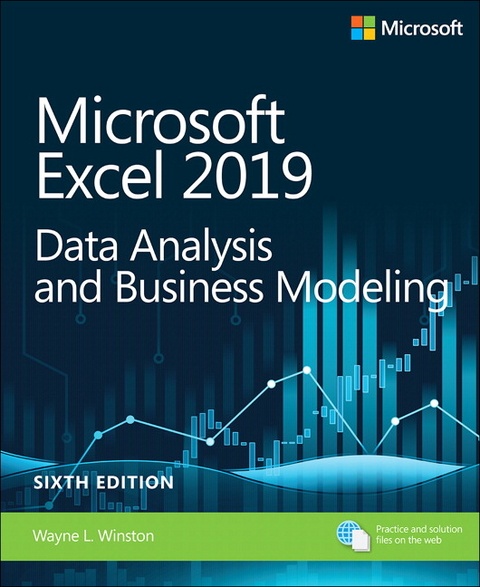
Microsoft Excel 2019 Data Analysis and Business Modeling
Microsoft Press (Verlag)
978-1-5093-0588-9 (ISBN)
- Titel erscheint in neuer Auflage
- Artikel merken
Wayne L. Winston is Professor Emeritus of Decision Sciences at Indiana University’s Kelley School of Business, where he won 40+ teaching awards. He developed spreadsheet modeling coursework for Harvard Business School Publishing, and has taught or consulted on using Excel to improve decision-making at Microsoft, Cisco, Morgan Stanley, Pfizer, Verizon, the U.S. Navy, U.S. Army, and many other organizations. A two-time Jeopardy! Champion, he co-developed the Dallas Mavericks’ player tracking and rating system.
Chapter 1 Basic spreadsheet modeling
Chapter 2 Range names
Chapter 3 Lookup functions
Chapter 4 The INDEX function
Chapter 5 The MATCH function
Chapter 6 Text functions
Chapter 7 Dates and date functions
Chapter 8 Evaluating investment by using net present value criteria
Chapter 9 Internal rate of return
Chapter 10 More Excel financial functions
Chapter 11 Circular references
Chapter 12 IF statements
Chapter 13 Time and time functions
Chapter 14 The Paste Special command
Chapter 15 Three-dimensional formulas and hyperlinks
Chapter 16 The auditing tool
Chapter 17 Sensitivity analysis with data tables
Chapter 18 The Goal Seek command
Chapter 19 Using the Scenario Manager for sensitivity analysis
Chapter 20 The COUNTIF, COUNTIFS, COUNT, COUNTA, and COUNTBLANK functions
Chapter 21 The SUMIF, AVERAGEIF, SUMIFS, and AVERAGEIFS functions
Chapter 22 The OFFSET function
Chapter 23 The INDIRECT function
Chapter 24 Conditional formatting
Chapter 25 Sorting in Excel
Chapter 26 Tables
Chapter 27 Spin buttons, scroll bars, option buttons, check boxes, combo boxes, and group list boxes
Chapter 28 The analytics revolution
Chapter 29 An introduction to optimization with Excel Solver
Chapter 30 Using Solver to determine the optimal product mix
Chapter 31 Using Solver to schedule your workforce
Chapter 32 Using Solver to solve transportation or distribution problems
Chapter 33 Using Solver for capital budgeting
Chapter 34 Using Solver for financial planning
Chapter 35 Using Solver to rate sports teams
Chapter 36 Warehouse location and the GRG Multistart and Evolutionary Solver engines
Chapter 37 Penalties and the Evolutionary Solver
Chapter 38 The traveling salesperson problem
Chapter 39 Importing data from a text file or document
Chapter 40 Validating data
Chapter 41 Summarizing data by using histograms and Pareto charts
Chapter 42 Summarizing data by using descriptive statistics
Chapter 43 Using PivotTables and slicers to describe data
Chapter 44 The Data Model
Chapter 45 Power Pivot
Chapter 46 Power View and 3D Maps
Chapter 47 Sparklines
Chapter 48 Summarizing data with database statistical functions
Chapter 49 Filtering data and removing duplicates
Chapter 50 Consolidating data
Chapter 51 Creating subtotals
Chapter 52 Charting tricks
Chapter 53 Estimating straight-line relationships
Chapter 54 Modeling exponential growth
Chapter 55 The power curve
Chapter 56 Using correlations to summarize relationships
Chapter 57 Introduction to multiple regression
Chapter 58 Incorporating qualitative factors into multiple regression
Chapter 59 Modeling nonlinearities and interactions
Chapter 60 Analysis of variance: One-way ANOVA
Chapter 61 Randomized blocks and two-way ANOVA
Chapter 62 Using moving averages to understand time series
Chapter 63 Winters method
Chapter 64 Ratio-to-moving-average forecast method
Chapter 65 Forecasting in the presence of special events
Chapter 66 An introduction to probability
Chapter 67 An introduction to random variables
Chap
| Erscheinungsdatum | 03.05.2019 |
|---|---|
| Reihe/Serie | Business Skills |
| Verlagsort | Boston |
| Sprache | englisch |
| Maße | 188 x 231 mm |
| Gewicht | 1340 g |
| Themenwelt | Informatik ► Office Programme ► Excel |
| Informatik ► Office Programme ► Outlook | |
| ISBN-10 | 1-5093-0588-2 / 1509305882 |
| ISBN-13 | 978-1-5093-0588-9 / 9781509305889 |
| Zustand | Neuware |
| Informationen gemäß Produktsicherheitsverordnung (GPSR) | |
| Haben Sie eine Frage zum Produkt? |
aus dem Bereich


