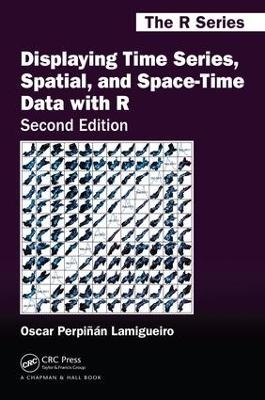
Displaying Time Series, Spatial, and Space-Time Data with R
CRC Press (Verlag)
978-1-138-08998-3 (ISBN)
Focusing on the exploration of data with visual methods, Displaying Time Series, Spatial, and Space-Time Data with R, Second Edition, presents methods and R code for producing high-quality static graphics, interactive visualizations, and animations of time series, spatial, and space-time data. Practical examples using real-world datasets help you understand how to apply the methods and code.
The book illustrates how to display a dataset starting with an easy and direct approach, and progressively adds improvements that involve more complexity. Each of the three parts of the book is devoted to different types of data. In each part, the chapters are grouped according to the various visualization methods or data characteristics.
The first edition of this book was mainly focused on static graphics. Four years later, recent developments in the "htmlwidgets" family of packages are covered in this second edition with many new interactive graphics. In addition, the "ggplot2" approach is now used in most of the spatial graphics, thanks to the new "sf" package. Finally, code has been cleaned and improved, and data has been updated.
Features
• Offers detailed information on producing high-quality graphics, interactive visualizations, and animations
• Uses real data from meteorological, climate, economic, social science, energy, engineering, environmental, and epidemiological research in many practical examples
• Shows how to improve graphics based on visualization theory
• Provides the graphics, data, and R code on the author’s website, enabling you to practice with the methods and modify the code to suit your own needs.
Oscar Perpiñán-Lamigueiro is an Associate Professor at the Universidad Politécnica de Madrid, involved in teaching and research of Electrical Engineering, Electronics and Programming. He is also a lecturer of Photovoltaic and Solar Energy at the Escuela de Organización Industrial. He holds a Master's Degree in Telecommunications Engineering and a PhD in Industrial Engineering. At present, his research focuses on solar radiation (forecasting, spatial interpolation, open data) and software development with R (packages rasterVis, solaR, meteoForecast, PVF, tdr).
Introduction
What This Book Is About
What You Will Not Find in This Book
How to Read This Book
R Graphics
Packages
Software Used to Write This Book
About the Author
Acknowledgments
I Time Series
Displaying Time Series: Introduction
Packages
Further Reading
Time on the Horizontal Axis
Time Graph of Variables with Different Scales
Time Series of Variables with the Same Scale
Stacked Graphs
Interactive Graphics
Time as a Conditioning or Grouping Variable
Scatterplot Matrix: Time as a Grouping Variable
Scatterplot with Time as a Conditioning Variable
Time as a Complementary Variable
Polylines
A Panel for Each Year
Interactive Graphics: Animation
About the Data
SIAR
Unemployment in the United States
Gross National Income and CO Emissions
II Spatial Data
Displaying Spatial Data: Introduction
Packages
Further Reading
Thematic Maps: Proportional Symbol Mapping
Introduction
Proportional Symbol Mapping with spplot
Proportional Symbol Mapping with ggplot
Optimal Classification and Sizes to Improve Discrimination
Spatial Context with Underlying Layers and Labels
Spatial Interpolation
Interactive Graphics
Thematic Maps: Choropleth Maps
Introduction
Quantitative Variable
Qualitative Variable
Small Multiples with Choropleth Maps
Bivariate Map
Interactive Graphics
Thematic Maps: Raster Maps
Quantitative Data
Categorical Data
bBivariate Legend
Interactive Graphics
Vector Fields
Introduction
Arrow Plot
Streamlines
Physical and Reference Maps
Physical Maps
Reference maps
About the Data
Air Quality in Madrid
Spanish General Elections
CM SAF
Land Cover and Population Rasters
III Space-Time Data
Displaying Spatiotemporal Data: Introduction
Packages
Further Reading
Spatiotemporal Raster Data
Introduction
Level Plots
Graphical Exploratory Data Analysis
Space-Time and Time Series Plots
Spatiotemporal Point Observations
Introduction
Graphics with spacetime
Animation
Depicting variable changes over time: raster data
bDepicting variable changes over time: point space-time data
Fly-by animation
| Erscheinungsdatum | 17.09.2018 |
|---|---|
| Reihe/Serie | Chapman & Hall/CRC The R Series |
| Verlagsort | London |
| Sprache | englisch |
| Maße | 156 x 234 mm |
| Gewicht | 1690 g |
| Themenwelt | Mathematik / Informatik ► Mathematik ► Wahrscheinlichkeit / Kombinatorik |
| ISBN-10 | 1-138-08998-2 / 1138089982 |
| ISBN-13 | 978-1-138-08998-3 / 9781138089983 |
| Zustand | Neuware |
| Haben Sie eine Frage zum Produkt? |
aus dem Bereich


