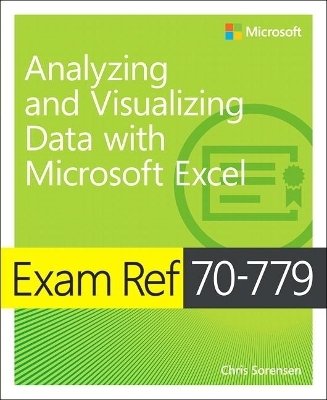
Exam Ref 70-779 Analyzing and Visualizing Data with Microsoft Excel
Seiten
2018
Microsoft Press (Verlag)
978-1-5093-0804-0 (ISBN)
Microsoft Press (Verlag)
978-1-5093-0804-0 (ISBN)
- Titel ist leider vergriffen;
keine Neuauflage - Artikel merken
Prepare for Microsoft Exam 70-779—and help demonstrate your real-world mastery of Microsoft Excel data analysis and visualization. Designed for BI professionals, data analysts, and others who analyze business data with Excel, this Exam Ref focuses on the critical thinking and decision-making acumen needed for success at the MCSA level.
Prepare for Microsoft Exam 70-779–and help demonstrate your real-world mastery of Microsoft Excel data analysis and visualization. Designed for BI professionals, data analysts, and others who analyze business data with Excel, this Exam Ref focuses on the critical thinking and decision-making acumen needed for success at the MCSA level.
Focus on the expertise measured by these objectives:
Consume and transform data by using Microsoft Excel
Model data, from building and optimizing data models through creating performance KPIs, actual and target calculations, and hierarchies
Visualize data, including creating and managing PivotTables and PivotCharts, and interacting with PowerBI
This Microsoft Exam Ref:
Organizes its coverage by exam objectives
Features strategic, what-if scenarios to challenge you
Assumes you have a strong understanding of how to use Microsoft Excel to perform data analysis
Chris Sorensen, MCSE (Data Management and Analytics) and MCT, is the Founder and President of Iteration Insights Ltd. He is a consultant, architect, educator, and coach who has been working in the Analytics space for nearly 20 years. Over his career, he has provided strategic and architectural advisory services to many clients and most recently he has been involved with leading numerous Power BI and Excel PowerPivot projects. He has evangelized both Excel and Power BI with Microsoft since July 2015. Follow him on both Linkedin and Twitter as @wjdataguy.
Chapter 1 Consume and transform data by using Microsoft Excel
Chapter 2 Model data
Chapter 3 Visualize data
| Erscheinungsdatum | 07.09.2018 |
|---|---|
| Reihe/Serie | Exam Ref |
| Verlagsort | Boston |
| Sprache | englisch |
| Maße | 190 x 230 mm |
| Gewicht | 451 g |
| Themenwelt | Informatik ► Office Programme ► Office |
| Informatik ► Office Programme ► Excel | |
| Informatik ► Office Programme ► Outlook | |
| Informatik ► Weitere Themen ► Zertifizierung | |
| ISBN-10 | 1-5093-0804-0 / 1509308040 |
| ISBN-13 | 978-1-5093-0804-0 / 9781509308040 |
| Zustand | Neuware |
| Informationen gemäß Produktsicherheitsverordnung (GPSR) | |
| Haben Sie eine Frage zum Produkt? |
Mehr entdecken
aus dem Bereich
aus dem Bereich
Buch | Softcover (2024)
John Wiley & Sons Inc (Verlag)
CHF 74,90
Für alle Editionen inklusive Office 365
Buch | Hardcover (2019)
O'Reilly (Verlag)
CHF 41,85
Buch | Softcover (2022)
Addison Wesley (Verlag)
CHF 68,25


