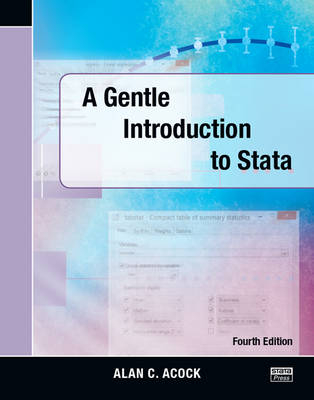
A Gentle Introduction to Stata, Fourth Edition
Stata Press (Verlag)
978-1-59718-142-6 (ISBN)
- Titel erscheint in neuer Auflage
- Artikel merken
The fourth edition has incorporated numerous changes that were new with Stata 13. Coverage of the marginsplot command has expanded. This simplifies the construction of compelling graphs. There is a new chapter showing how to estimate path models using the sem (structural equation modeling) command. Menus have been updated, and several minor changes and corrections have been included based on suggestions from readers.
Alan Acock is a sociologist and a University Distinguished Professor in the School of Social and Behavioral Health Sciences at Oregon State University. He held the Knudson Chair in Family Research and was also recognized as the Alumni Distinguished Professor based on his work with students. He is the author of Discovering Structural Equation Modeling Using Stata, Revised Edition. He has published more than 150 articles in leading journals across the social and behavioral sciences, including Structural Equation Modeling, Psychological Bulletin, Multivariate Behavioral Research, Journal of Gerontology, Journal of Adolescence, American Journal of Public Health, American Sociological Review, Journal of Marriage and Family, Social Forces, Drug and Alcohol Dependence, Educational and Psychological Measurement, Journal of Politics, Prevention Science, American Journal of Preventive Medicine, and many others. With this broad experience, Acock brings examples from a variety of disciplines.
List of figures
List of tables
List of boxed tips
Preface
Support materials for the book
Getting started
Conventions
Introduction
The Stata screen
Using an existing dataset
An example of a short Stata session
Summary
Exercises
Entering data
Creating a dataset
An example questionnaire
Developing a coding system
Entering data using the Data Editor
The Variables Manager
The Data Editor (Browse) view
Saving your
Checking the data
Summary
Exercises
Preparing data for analysis
Introduction
Planning your work
Creating value labels
Reverse-code variables
Creating and modifying variables
Creating scales
Saving some of your data
Summary
Exercises
Working with commands, do-files, and results
Introduction
How Stata commands are constructed
Creating a do-file
Copying your results to a word processor
Logging your command file
Summary
Exercises
Descriptive statistics and graphs for one variable
Descriptive statistics and graphs
Where is the center of a distribution?
How dispersed is the distribution?
Statistics and graphs—unordered categories
Statistics and graphs—ordered categories and variables
Statistics and graphs—quantitative variables
Summary
Exercises
Statistics and graphs for two categorical variables
Relationship between categorical variables
Cross-tabulation
Chi-squared test
Percentages and measures of association
Odds ratios when dependent variable has two categories
Ordered categorical variables
Interactive tables
Tables—linking categorical and quantitative variables
Power analysis when using a chi-squared test of significance
Summary
Exercises
Tests for one or two means
Introduction to tests for one or two means
Randomization
Random sampling
Hypotheses
One-sample test of a proportion
Two-sample test of a proportion
One-sample test of means
Two-sample test of group means
Repeated-measures t test
Power analysis
Nonparametric alternatives
Summary
Exercises
Bivariate correlation and regression
Introduction to bivariate correlation and regression
Scattergrams
Plotting the regression line
An alternative to producing a scattergram, binscatter
Correlation
Regression
Spearman’s rho: Rank-order correlation for ordinal data
Summary
Exercises
Analysis of variance
The logic of one-way analysis of variance
ANOVA example
ANOVA example using survey data
A nonparametric alternative to ANOVA
Analysis of covariance
Two-way ANOVA
Repeated-measures design
Intraclass correlation—measuring agreement
Power analysis with ANOVA
Power analysis for two-way ANOVA
Summary
Exercises
Multiple regression
Introduction to multiple regression
What is multiple regression?
The basic multiple regression command
Increment in R-squared: Semipartial correlations
Is the dependent variable normally distributed?
Are the residuals normally distributed?
Regression diagnostic statistics
Weighted data
Categorical predictors and hierarchical regression
A shortcut for working with a categorical variable
Fundamentals of interaction
Nonlinear relations
Power analysis in multiple regression
Summary
Exercises
Logistic regression
Introduction to logistic regression
An example
What is an odds ratio and a logit?
Data used in the rest of the chapter
Logistic regression
Hypothesis testing
More on interpreting results from logistic regression
Nested logistic regressions
Power analysis when doing logistic regression
Summary
Exercises
Measurement, reliability, and validity
Overview of reliability and validity
Constructing a scale
Reliability
Validity
Factor analysis
PCF analysis
But we wanted one scale, not four scales
Summary
Exercises
Working with missing values—multiple imputation
The nature of the problem
Multiple imputation and its assumptions about the mechanism for missingness
What variables do we include when doing imputations?
Multiple imputation
A detailed example
Summary
Exercises
The sem and gsem commands
Ordinary least-squares regression models using sem
A quick way to draw a regression model and a fresh start
The gsem command for logistic regression
Path analysis and mediation
Conclusions and what is next for the sem command
Exercises
What’s next?
Introduction to the appendix
Resources
Summary
References
Author index
Subject index
| Verlagsort | College Station |
|---|---|
| Sprache | englisch |
| Gewicht | 975 g |
| Themenwelt | Geisteswissenschaften ► Psychologie |
| Mathematik / Informatik ► Mathematik ► Computerprogramme / Computeralgebra | |
| ISBN-10 | 1-59718-142-0 / 1597181420 |
| ISBN-13 | 978-1-59718-142-6 / 9781597181426 |
| Zustand | Neuware |
| Informationen gemäß Produktsicherheitsverordnung (GPSR) | |
| Haben Sie eine Frage zum Produkt? |
aus dem Bereich


