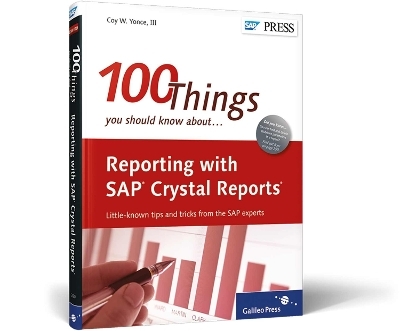
100 Things You Should Know About Reporting with SAP Crystal Reports
SAP Press (Verlag)
978-1-59229-390-2 (ISBN)
- Titel ist leider vergriffen;
keine Neuauflage - Artikel merken
Coy W. Yonce, III has worked in the business intelligence industry for the past nine years in varying capacities. He has held positions ranging from highly technical roles supporting customers to account management roles for many Fortune 100 customers. Formerly the Crystal Reports product manager at SAP, responsible for the overall business user experience within SAP BusinessObjects, he is now a principal technical architect at EV Technologies.
... Acknowledgments ... 11
PART 1 ... Report Layout ... 13
... 1 ... Creating Reports with Different Page Headers ... 14
... 2 ... Repeating Group Headers across Pages ... 17
... 3 ... Adding Watermarks to Reports ... 19
... 4 ... Setting Up Unlinked Subreports ... 22
... 5 ... Setting Up Linked Subreports ... 25
... 6 ... Using Subreports as Templates for Headers and Footers ... 28
... 7 ... Using On Demand or In Place ... 31
... 8 ... Passing Data between Subreports and Main Reports ... 34
... 9 ... Suppressing and Hiding Sections ... 38
... 10 ... Suppressing a Blank Subreport or a Section with a Blank Subreport ... 41
... 11 ... Creating Side-by-Side Reports ... 44
... 12 ... Suppressing Duplicate Rows ... 47
... 13 ... Displaying Records Horizontally ... 50
... 14 ... Displaying a Checkbox in a Report ... 52
... 15 ... Designing a Cover Page for Reports ... 54
PART 2 ... Field Formatting ... 57
... 16 ... Printing Vertical Text Fields Alongside Horizontal Text Fields ... 58
... 17 ... Concatenating Strings with Different Formats ... 61
... 18 ... Aligning the Vertical Alignment of Text in a Field ... 65
... 19 ... Inserting Leading Zeroes for a Field ... 69
... 20 ... Formatting Parts of a String ... 72
... 21 ... Forcing a Header or Footer to Grow Automatically or Remain a Specific Size ... 74
... 22 ... Displaying Values in a Field That's Based on a Parameter ... 77
... 23 ... Creating a Running Total with Values Derived from a Formula Field ... 81
... 24 ... Creating a Formula to Calculate an Average while Ignoring Zero Values ... 85
... 25 ... Creating a Formula to Calculate a Minimum while Ignoring Zero Values ... 87
... 26 ... Performing Data Type Conversions ... 90
... 27 ... Checking for the Existence of Text ... 93
PART 3 ... Types of Reports and Forms ... 97
... 28 ... Creating Reports for Immediate Decision Making ... 98
... 29 ... Creating Reports to Support Front Line Managers ... 102
... 30 ... Creating Reports for Upper-Level Management ... 105
... 31 ... Creating Mailing Labels ... 109
... 32 ... Creating an Earnings Statement for a Paycheck ... 112
... 33 ... Creating a Table of Contents for a Report ... 115
... 34 ... Creating Calendars from an Excel Spreadsheet ... 119
... 35 ... Laying Out Form Fields ... 124
PART 4 ... Guided Analysis ... 127
... 36 ... Highlighting Information ... 128
... 37 ... Showing Visual Indicators ... 131
... 38 ... Creating Tool Tips ... 133
... 39 ... Enabling Drill-Down Reporting ... 136
... 40 ... Creating a Gradual Drill-Down in a Report ... 138
... 41 ... Sorting and Ranking within a Group ... 141
... 42 ... Displaying Top N Records in a Report Based on a Parameter ... 144
... 43 ... Applying and Formatting a Sort or Rank in a Crosstab ... 147
... 44 ... Applying Color Banding to a Report ... 149
... 45 ... Creating and Using Parameters in a Report ... 152
... 46 ... Creating Dynamic Cascading Parameters ... 156
PART 5 ... Using Web Technology with Reports ... 159
... 47 ... Creating Reports from HTML Content ... 160
... 48 ... Creating Hyperlinks in a Report ... 163
... 49 ... Formatting Reports Using Cascading Style Sheets ... 166
... 50 ... Creating Reports from Local XML Documents ... 170
... 51 ... Using Web Services as a Data Source for a Report ... 172
... 52 ... Creating XML Documents Using SAP Crystal Reports ... 175
... 53 ... Publishing Reports as a Web Service ... 178
PART 6 ... Charting ... 181
... 54 ... Inserting Bar Charts in Report Details ... 182
... 55 ... Creating a Combo Chart that Contains a Bar and Line Visualization ... 185
... 56 ... Using Overlays with Complex Charting ... 188
... 57 ... Removing Decimals in the X- and Y-Axis ... 191
... 58 ... Formatting Dates in a Chart ... 195
... 59 ... Creating Visualizations with Negative Values ... 199
PART 7 ... Creating Reusable and Accessible Report Diagrams ... 203
... 60 ... Creating Effective Report Templates ... 204
... 61 ... Providing Default Formatting for a Field ... 208
... 62 ... Using Chart Styles to Eliminate Unnecessary Report Elements ... 211
... 63 ... Creating Reusable Formulas ... 215
... 64 ... Setting Default Formatting Options ... 218
... 65 ... Using Color Effectively ... 221
... 66 ... Making Text Legible ... 224
... 67 ... Ordering Report Objects for Screen Readers ... 227
... 68 ... Making Tables Accessible for Screen Readers ... 230
... 69 ... Naming Formula Fields for Ease of Use ... 232
PART 8 ... Using Parameters ... 235
... 70 ... Displaying Parameter Values in a Report ... 236
... 71 ... Creating a Parameter That Provides an ALL Value ... 239
... 72 ... Allowing Wildcards as a Parameter Value ... 241
... 73 ... Providing Users with Groupings as a Parameter Value ... 243
... 74 ... Controlling Values Entered into Parameters ... 246
... 75 ... Finding and Deleting Stubborn Parameters from a Report ... 250
... 76 ... Prompting the User for the N Value to Use for Top N Reports ... 253
PART 9 ... Distributing Reports ... 257
... 77 ... Scheduling Timely Reports ... 258
... 78 ... Running Reports Based on Events or Triggers ... 261
... 79 ... Designing Reports for Effective Excel Exports ... 264
... 80 ... Choosing the Right Excel Export Option ... 267
... 81 ... Analyzing Report Data with SAP BusinessObjects Explorer ... 270
... 82 ... Sharing Reports on the Web ... 273
... 83 ... Embedding Dynamic Reports in Microsoft Office Documents ... 275
... 84 ... Exporting Reports to XML ... 279
... 85 ... Creating Read-Only Reports ... 281
PART 10 ... Extending the Design Experience ... 285
... 86 ... Working with Files within a Report ... 286
... 87 ... Sending Emails from a Report ... 289
... 88 ... Exporting Data to CSV While Processing a Report ... 292
... 89 ... Exporting Data to XML While Processing a Report ... 295
... 90 ... Creating Barcodes in Your Reports ... 298
... 91 ... Creating QR Codes in Reports ... 300
... 92 ... Looking Up Text in an External File ... 303
... 93 ... Creating a Report Index from an Existing Report ... 305
... 94 ... Using Templates to Create Labels ... 307
... 95 ... Accessing Windows Functionality from a Report ... 310
PART 11 ... Monitoring and Improving Report Performance ... 313
... 96 ... Using a Built-in Dialogue to Monitor Report Performance ... 314
... 97 ... Using Selection Formulas to Restrict Report Queries ... 317
... 98 ... Hiding Unnecessary Data ... 320
... 99 ... Offloading the Processing of Report Functions ... 322
... 100 ... Using SQL Expressions ... 325
... The Author ... 329
... Index ... 331
| Erscheint lt. Verlag | 30.11.2011 |
|---|---|
| Reihe/Serie | SAP PRESS Englisch |
| Verlagsort | Maryland |
| Sprache | englisch |
| Maße | 175 x 228 mm |
| Einbandart | gebunden |
| Themenwelt | Mathematik / Informatik ► Informatik ► Netzwerke |
| Informatik ► Weitere Themen ► SAP | |
| ISBN-10 | 1-59229-390-5 / 1592293905 |
| ISBN-13 | 978-1-59229-390-2 / 9781592293902 |
| Zustand | Neuware |
| Informationen gemäß Produktsicherheitsverordnung (GPSR) | |
| Haben Sie eine Frage zum Produkt? |
aus dem Bereich


