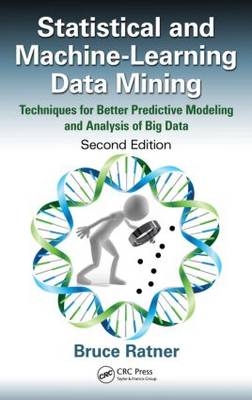
Statistical and Machine-Learning Data Mining
Crc Press Inc (Verlag)
9781439860915 (ISBN)
- Titel ist leider vergriffen;
keine Neuauflage - Artikel merken
The statistical data mining methods effectively consider big data for identifying structures (variables) with the appropriate predictive power in order to yield reliable and robust large-scale statistical models and analyses. In contrast, the author's own GenIQ Model provides machine-learning solutions to common and virtually unapproachable statistical problems. GenIQ makes this possible — its utilitarian data mining features start where statistical data mining stops.
This book contains essays offering detailed background, discussion, and illustration of specific methods for solving the most commonly experienced problems in predictive modeling and analysis of big data. They address each methodology and assign its application to a specific type of problem. To better ground readers, the book provides an in-depth discussion of the basic methodologies of predictive modeling and analysis. While this type of overview has been attempted before, this approach offers a truly nitty-gritty, step-by-step method that both tyros and experts in the field can enjoy playing with.
Bruce Ratner, DM STAT-l Consulting
Introduction
The Personal Computer and Statistics
Statistics and Data Analysis
EDA
The EDA Paradigm
EDA Weaknesses
Small and Big Data
Data Mining Paradigm
Statistics and Machine Learning
Statistical Data Mining
References
Two Basic Data Mining Methods for Variable Assessment
Introduction
Correlation Coefficient
Scatterplots
Data Mining
Smoothed Scatterplot
General Association Test
Summary
References
CHAID-Based Data Mining for Paired-Variable Assessment
Introduction
The Scatterplot
The Smooth Scatterplot
Primer on CHAID
CHAID-Based Data Mining for a Smoother Scatterplot
Summary
References
Appendix
The Importance of Straight Data: Simplicity and Desirability for Good Model-Building Practice
Introduction
Straightness and Symmetry in Data
Data Mining Is a High Concept
The Correlation Coefficient
Scatterplot of (xx3, yy3)
Data Mining the Relationship of (xx3, yy3)
What Is the GP-Based Data Mining Doing to the Data?
Straightening a Handful of Variables and a Dozen of Two Baker’s Dozens of Variables
Summary
References
Symmetrizing Ranked Data: A Statistical Data Mining Method for Improving the Predictive Power of Data
Introduction
Scales of Measurement
Stem-and-Leaf Display
Box-and-Whiskers Plot
Illustration of the Symmetrizing Ranked Data Method
Summary
References
Principal Component Analysis: A Statistical Data Mining Method for Many-Variable Assessment
Introduction
EDA Reexpression Paradigm
What Is the Big Deal?
PCA Basics
Exemplary Detailed Illustration
Algebraic Properties of PCA
Uncommon Illustration
PCA in the Construction of a Quasi-Interaction Variable
Summary
The Correlation Coefficient: Its Values Range between Plus/Minus 1, or Do They?
Introduction
Basics of the Correlation Coefficient
Calculation of the Correlation Coefficient
Rematching
Calculation of the Adjusted Correlation Coefficient
Implication of Rematching
Summary
Logistic Regression: The Workhorse of Response Modeling
Introduction
Logistic Regression Model
Case Study
Logits and Logit Plots
The Importance of Straight Data
Reexpressing for Straight
Straight Data for Case Study
Technique†s When Bulging Rule Does Not Apply
Reexpressing MOS_OPEN
Assessing the Importance of Variables
Important Variables for Case Study
Relative Importance of the Variables
Best Subset of Variables for Case Study
Visual Indicators of Goodness of Model Predictions
Evaluating the Data Mining Work
Smoothing a Categorical Variable
Additional Data Mining Work for Case Study
Summary
Ordinary Regression: The Workhorse of Profit Modeling
Introduction
Ordinary Regression Model
Mini Case Study
Important Variables for Mini Case Study
Best Subset of Variables for Case Study
Suppressor Variable AGE
Summary
References
Variable Selection Methods in Regression: Ignorable Problem, Notable Solution
Introduction
Background
Frequently Used Variable Selection Methods
Weakness in the Stepwise
Enhanced Variable Selection Method
Exploratory Data Analysis
Summary
References
CHAID for Interpreting a Logistic Regression Model
Introduction
Logistic Regression Model
Database Marketing Response Model Case Study
CHAID
Multivariable CHAID Trees
CHAID Market Segmentation
CHAID Tree Graphs
Summary
The Importance of the Regression Coefficient
Introduction
The Ordinary Regression Model
Four Questions
Important Predictor Variables
P Values and Big Data
Returning to Question 1
Effect of Predictor Variable on Prediction
The Caveat
Returning to Question 2
Ranking Predictor Variables by Effect on Prediction
Returning to Question 3
Returning to Question 4
Summary
References
The Average Correlation: A Statistical Data Mining Measure for Assessment of Competing Predictive Models and the Importance of the Predictor Variables
Introduction
Background
Illustration of the Difference between Reliability and Validity
Illustration of the Relationship between Reliability and Validity
The Average Correlation
Summary
Reference
CHAID for Specifying a Model with Interaction Variables
Introduction
Interaction Variables
Strategy for Modeling with Interaction Variables
Strategy Based on the Notion of a Special Point
Example of a Response Model with an Interaction Variable
CHAID for Uncovering Relationships
Illustration of CHAID for Specifying a Model
An Exploratory Look
Database Implication
Summary
References
Market Segmentation Classification Modeling with Logistic Regression
Introduction
Binary Logistic Regression
Polychotomous Logistic Regression Model
Model Building with PLR
Market Segmentation Classification Model
Summary
CHAID as a Method for Filling in Missing Values
Introduction
Introduction to the Problem of Missing Data
Missing Data Assumption
CHAID Imputation
Illustration
CHAID Most Likely Category Imputation for a Categorical Variable
Summary
References
Identifying Your Best Customers: Descriptive, Predictive, and Look-Alike Profiling
Introduction
Some Definitions
Illustration of a Flawed Targeting Effort
Well-Defined Targeting Effort
Predictive Profiles
Continuous Trees
Look-Alike Profiling
Look-Alike Tree Characteristics
Summary
Assessment of Marketing Models
Introduction
Accuracy for Response Model
Accuracy for Profit Model
Decile Analysis and Cum Lift for Response Model
Decile Analysis and Cum Lift for Profit Model
Precision for Response Model
Precision for Profit Model
Separability for Response and Profit Models
Guidelines for Using Cum Lift, HL/SWMAD, and CV
Summary
Bootstrapping in Marketing: A New Approach for Validating Models
Introduction
Traditional Model Validation
Illustration
Three Questions
The Bootstrap
How to Bootstrap
Bootstrap Decile Analysis Validation
Another Question
Bootstrap Assessment of Model Implementation Performance
Summary
References
Validating the Logistic Regression Model: Try Bootstrapping
Introduction
Logistic Regression Model
The Bootstrap Validation Method
Summary
Reference
Visualization of Marketing ModelsData Mining to Uncover Innards of a Model
Introduction
Brief History of the Graph
Star Graph Basics
Star Graphs for Single Variables
Star Graphs for Many Variables Considered Jointly
Profile Curves Method
Illustration
Summary
References
Appendix 1: SAS Code for Star Graphs for Each Demographic Variable about the Deciles
Appendix 2: SAS Code for Star Graphs for Each Decile about the Demographic Variables
Appendix 3: SAS Code for Profile Curves: All Deciles
The Predictive Contribution Coefficient: A Measure of Predictive Importance
Introduction
Background
Illustration of Decision Rule
Predictive Contribution Coefficient
Calculation of Predictive Contribution Coefficient
Extra Illustration of Predictive Contribution Coefficient
Summary
Reference
Regression Modeling Involves Art, Science, and Poetry, Too
Introduction
Shakespearean Modelogue
Interpretation of the Shakespearean Modelogue
Summary
Reference
Genetic and Statistic Regression Models: A Comparison
Introduction
Background
Objective
A Pithy Summary of the Development of Genetic Programming
The GenIQ Model: A Brief Review of Its Objective and Salient Features
The GenIQ Model: How It Works
Summary
References
Data Reuse: A Powerful Data Mining Effect of the GenIQ Model
Introduction
Data Reuse?
Illustration of Data Reuse
Modified Data Reuse: A GenIQ-Enhanced Regression Model
Summary
A Data Mining Method for Moderating Outliers Instead of Discarding Them
Introduction
Background
Moderating Outliers Instead of Discarding Them
Summary
Overfitting: Old Prˇoblem, New Solution
Introduction
Background
The GenIQ Model Solution to Overfitting
Summary
The Importance of Straight Data: Revisited
Introduction
Restatement of Why It Is Important to Straighten
Restatement of Section 4.6"Data Mining the Relationship of (xx3, yy3)"
Summary
The GenIQ Model: Its Definition and an Application
Introduction
What Is Optimization?
What Is Genetic Modeling?
Genetic Modeling: An Illustration
Parameters for Controlling a Genetic Model Run
Genetic Modeling: Strengths and Limitations
Goals of Marketing Modeling
The GenIQ Response Model
The GenIQ Profit
Case Study: Response Model
Case Study: Profit Model
Summary
Reference
Finding the Best Variables for Marketing Models
Introduction
Background
Weakness in the Variable Selection Methods
Goals of Modeling in Marketing
Variable Selection with GenIQ
Nonlinear Alternative to Logistic Regression Model
Summary
References
Interpretation of Coefficient-Free Models
Introduction
The Linear Regression Coefficient
The Quasi-Regression Coefficient for Simple Regression Models
Partial Quasi-RC for the Everymodel
Quasi-RC for a Coefficient-Free Model
Summary
| Zusatzinfo | 75 equations - Last print over 600 copies at IBT - Also at PGK; 155 Tables, black and white; 183 Illustrations, black and white |
|---|---|
| Verlagsort | Bosa Roca |
| Sprache | englisch |
| Maße | 156 x 235 mm |
| Gewicht | 907 g |
| Themenwelt | Informatik ► Datenbanken ► Data Warehouse / Data Mining |
| Mathematik / Informatik ► Mathematik ► Statistik | |
| Wirtschaft ► Betriebswirtschaft / Management ► Marketing / Vertrieb | |
| ISBN-13 | 9781439860915 / 9781439860915 |
| Zustand | Neuware |
| Informationen gemäß Produktsicherheitsverordnung (GPSR) | |
| Haben Sie eine Frage zum Produkt? |
aus dem Bereich


