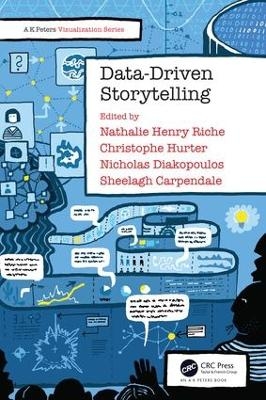
Data-Driven Storytelling
CRC Press (Verlag)
978-1-138-19710-7 (ISBN)
This book presents an accessible introduction to data-driven storytelling. Resulting from unique discussions between data visualization researchers and data journalists, it offers an integrated definition of the topic, presents vivid examples and patterns for data storytelling, and calls out key challenges and new opportunities for researchers and practitioners.
Dr. Nathalie Henry Riche is a researcher at Microsoft Research since December 2008. She holds a Ph.D. in computer science from the University of Paris XI and INRIA, France, as well as from the University of Sydney, Australia. Her research focuses on human-computer interaction and information visualization. Dr. Christophe Hurter is a professor at the Interactive Data Visualization group ( part of the DEVI team) of the French Civil Aviation University (ENAC) in Toulouse, France. Dr. Nicholas Diakopoulos is an Assistant Professor at the Northwestern University School of Communication where he directs the Computational Journalism Lab Dr. Sheelagh Carpendale is a professor in the Department of Computer Science at the University of Calgary where she holds a Canada Research Chair in Information Visualization, the NSERC/AITF/SMART Technologies Industrial Research Chair in Interactive Technologies and leads the Innovations in Visualization (InnoVis) research group.
Introduction. From Cognitive to Design Principles. Exploration and Explanation in Data-Driven Storytelling. Data-Driven Storytelling Techniques: Analysis of a Curated Collection of Visual Stories. Narrative Design Patterns for Data-Driven Storytelling. Watches to Augmented Reality Devices and Gadgets for Data-Driven Storytelling. From Analysis to Communication Supporting the Lifecycle of a Story. Organizing the Work of Data-Driven Visual Storytelling. Communicating Data to an Audience.Ethics in Data-Driven Visual Storytelling. Evaluating Data-Driven Stories & Storytelling Tools.
| Erscheinungsdatum | 07.01.2018 |
|---|---|
| Reihe/Serie | AK Peters Visualization Series |
| Zusatzinfo | 10 Tables, black and white; 15 Line drawings, color; 1 Line drawings, black and white; 41 Halftones, color; 3 Halftones, black and white; 56 Illustrations, color; 14 Illustrations, black and white |
| Verlagsort | London |
| Sprache | englisch |
| Maße | 156 x 234 mm |
| Gewicht | 538 g |
| Themenwelt | Geisteswissenschaften ► Sprach- / Literaturwissenschaft ► Literaturwissenschaft |
| Informatik ► Datenbanken ► Data Warehouse / Data Mining | |
| Sozialwissenschaften ► Kommunikation / Medien ► Journalistik | |
| Technik | |
| ISBN-10 | 1-138-19710-6 / 1138197106 |
| ISBN-13 | 978-1-138-19710-7 / 9781138197107 |
| Zustand | Neuware |
| Haben Sie eine Frage zum Produkt? |
aus dem Bereich


