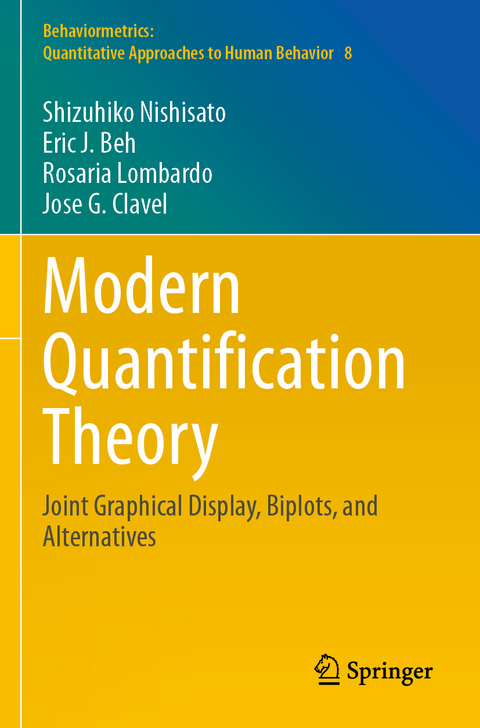
Modern Quantification Theory
Joint Graphical Display, Biplots, and Alternatives
Seiten
2022
|
1st ed. 2021
Springer Verlag, Singapore
978-981-16-2472-8 (ISBN)
Springer Verlag, Singapore
978-981-16-2472-8 (ISBN)
This book offers a new look at well-established quantification theory for categorical data, referred to by such names as correspondence analysis, dual scaling, optimal scaling, and homogeneity analysis. These multiple identities are a consequence of its large number of properties that allow one to analyze and visualize the strength of variable association in an optimal solution. The book contains modern quantification theory for analyzing the association between two and more categorical variables in a variety of applicative frameworks.
Visualization has attracted much attention over the past decades and given rise to controversial opinions. One may consider variations of plotting systems used in the construction of the classic correspondence plot, the biplot, the Carroll-Green-Schaffer scaling, or a new approach in doubled multidimensional space as presented in the book. There are even arguments for no visualization at all.
The purpose of this book therefore is to shed new light on time-honored graphical procedures with critical reviews, new ideas, and future directions as alternatives. This stimulating volume is written with fresh new ideas from the traditional framework and the contemporary points of view. It thus offers readers a deep understanding of the ever-evolving nature of quantification theory and its practice.
Part I starts with illustrating contingency table analysis with traditional joint graphical displays (symmetric, non-symmetric) and the CGS scaling and then explores logically correct graphs in doubled Euclidean space for both row and column variables. Part II covers a variety of mathematical approaches to the biplot strategy in graphing a data structure, providing a useful source for this modern approach to graphical display. Part II is also concerned with a number of alternative approaches to the joint graphical display such as bimodal cluster analysis and other statistical problems relevant to quantification theory.
Shizuhiko Nishisato, Professor Emeritus, the Department of Educational Theory at the University of Toronto, Canada. Eric J. Beh is Professor of Statistics at the University of Newcastle, Australia. Rosaria Lombardo is Associate Professor at the University of Campania “Luigi Vanvitelli”, Italy. Jose G. Clavel is Full Professor at the Universidad de Murcia, Spain.
Personal Reflections.- Mathematical Preliminaries.- Mathematical Preliminaries.- Data Formats and Geometry.- Coordinates for Joint Graphs.- Clustering as an Alternative.- Scoring and Profiles.- Some Generalizations of Reciprocal Averaging.- History of the Biplot.- Biplots for Variants of Correspondence Analysis.
| Erscheinungsdatum | 28.07.2022 |
|---|---|
| Reihe/Serie | Behaviormetrics: Quantitative Approaches to Human Behavior ; 8 |
| Zusatzinfo | 9 Illustrations, color; 18 Illustrations, black and white; XVII, 231 p. 27 illus., 9 illus. in color. |
| Verlagsort | Singapore |
| Sprache | englisch |
| Maße | 155 x 235 mm |
| Themenwelt | Mathematik / Informatik ► Mathematik |
| Sozialwissenschaften ► Soziologie ► Empirische Sozialforschung | |
| Wirtschaft | |
| Schlagworte | biplots • Correspondence Analysis • Dual Scaling • Joint Graphical Display • Non-symmetric Scaling • Optimal Scaling • Quantification • Symmetric Scaling |
| ISBN-10 | 981-16-2472-0 / 9811624720 |
| ISBN-13 | 978-981-16-2472-8 / 9789811624728 |
| Zustand | Neuware |
| Informationen gemäß Produktsicherheitsverordnung (GPSR) | |
| Haben Sie eine Frage zum Produkt? |
Mehr entdecken
aus dem Bereich
aus dem Bereich
Buch | Hardcover (2023)
De Gruyter Oldenbourg (Verlag)
CHF 48,90
Gestalt und Struktur biographischer Selbstbeschreibungen
Buch | Softcover (2024)
Campus (Verlag)
CHF 49,95


