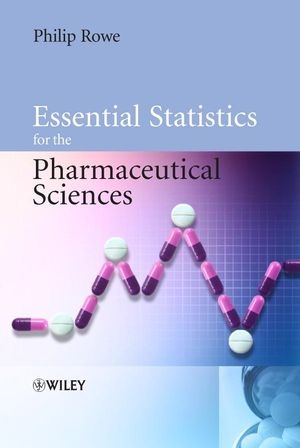
Essential Statistics for the Pharmaceutical Sciences
Wiley-Blackwell (Verlag)
978-0-470-03468-2 (ISBN)
- Titel erscheint in neuer Auflage
- Artikel merken
"...this text takes a novel approach...The style...is not as dry as other statistics texts, and so should not be intimidating even to a relative newcomer to the subject...The layout is easy to navigate, there are chapter aims, summaries and "key point boxes" throughout." -The Pharmaceutical Journal, 2008 This text is a clear, accessible introduction to the key statistical techniques employed for the analysis of data within this subject area. Written in a concise and logical manner, the book explains why statistics are necessary and discusses the issues that experimentalists need to consider. The reader is carefully taken through the whole process, from planning an experiment to interpreting the results, avoiding unnecessary calculation methodology. The most commonly used statistical methods are described in terms of their purpose, when they should be used and what they mean once they have been performed. Numerous examples are provided throughout the text, all within a pharmaceutical context, with key points highlighted in summary boxes to aid student understanding.
Essential Statistics for the Pharmaceutical Sciences takes a new and innovative approach to statistics with an informal style that will appeal to the reader who finds statistics a challenge! This book is an invaluable introduction to statistics for any science student. It is an essential text for students taking biomedical or pharmaceutical-based science degrees and also a useful guide for researchers.
Dr Philip Rowe. Reader in Pharmaceutical Computing, School of Pharmacy and Chemistry, Liverpool,?UK In addition to Dr Rowe's teaching and research at LJMU he also works on a consultancy basis offering advice and assistance with pharmacokinetic or general data analysis problems for the pharmaceutical industry, professional organizations and hospitals. He has recently secured a post delivering statistics training for the Institute of Clinical Research.
Preface . Statistical packages. PART 1. DATA TYPES. 1. Data types. 1.1Does it really matter? 1.2 Interval scale data. 1.3 Ordinal scale data. 1.4 Nominal scale data. 1.5 Structure of this book. 1.6 Chapter summary. PART 2. INTERVAL-SCALE DATA. 2. Descriptive statistics. 2.1 Summarizing data sets. 2.2 Indicators of central tendency. mean, median and mode. 2.3 Describing variability. standard deviation and coefficient of variation. 2.4 Quartiles. another way to describe data . 2.5 Using computer packages to generate descriptive statistics. 2.6 Chapter summary. 3. The normal distribution. 3.1 What is a normal distribution? . 3.2 Identifying data that are not normally distributed. 3.3 Proportions of individuals within one or two standard deviations of the mean. 3.4 Chapter summary. 4. Sampling from populations. the SEM. 4.1 Samples and populations. 4.2 From sample to population. 4.3 Types of sampling error. 4.4 What factors control the extent of random sampling error? 4.5 Estimating likely sampling error. The SEM. 4.6 Offsetting sample size against standard deviation. 4.7Chapter summary. 5. Ninety-five per cent confidence interval for the mean. 5.1 What is a confidence interval? 5.2 How wide should the interval be? 5.3 What do we mean by '95 per cent' confidence? 5.4 Calculating the interval width. 5.5 A long series of samples and 95 per cent confidence intervals. 5.6 How sensitive is the width of the confidence interval to changes in the SD, the sample size or the required level of confidence? 5.7 Two statements. 5.8 One-sided 95 per cent confidence intervals. 5.9 The 95 per cent confidence interval for the difference between two treatments. 5.10 The need for data to follow a normal distribution and data transformation. 5.11 Chapter summary. 6. The two-sample t-test(1).Introducing hypothesis tests. 6.1 The two-sample t-test. an example of a hypothesis test. 6.2 'Significance'. 6.3 The risk of a false positive finding. 6.4 What factors will influence whether or not we obtain a significant outcome? 6.5 Requirements for applying a two-sample t-test. 6.6 Chapter summary. 7. The two-sample t-test(2).The dreaded P value. 7.1 Measuring how significant a result is. 7.2 P values. 7.3 Two ways to define significance? 7.4 Obtaining the P value. 7.5 P values or 95 per cent confidence intervals? 7.6 Chapter summary. 8. The two-sample t-test(3).False negatives, power and necessary sample sizes. 8.1 What else could possibly go wrong? 8.2 Power. 8.3 Calculating necessary sample size. 8.4 Chapter summary. 9. The two-sample t-test(4).Statistical significance, practical significance and equivalence. 9.1 Practical significance. is the difference big enough to matter? 9.2 Equivalence testing. 9.3 Non-inferiority testing. 9.4 P values are less informative and can be positively misleading. 9.5 Setting equivalence limits prior to experimentation. 9.6 Chapter summary. 10. The two-sample t-test(5).One-sided testing. 10.1 Looking for a change in a specified direction. 10.2 Protection against false positives. 10.3 Temptation!. 10.4 Using a computer package to carry out a one-sided test. 10.5 Should one-sided tests be used more commonly? 10.5 Chapter summary. 11. What does a statistically significant result really tell us? 11.1 Interpreting statistical significance. 11.2 Starting from extreme scepticism. 11.3 Chapter summary. 12. The paired t-test. comparing two related sets of measurements. 12.1 Paired data. 12.2 We could analyse the data using a two-sample t-test. 12.3 Using a paired t-test instead. 12.4 Performing a paired t-test. 12.5 What determines whether a paired t-test will be significant? 12.6 Greater power of a paired t-test. 12.7 The paired t-test is only applicable to naturally paired data. 12.8 Choice of experimental design. 12.9 Requirements for applying a paired t-test . 12.10 Sample sizes, practical significance and one-sided tests. 12.11 Summarizing the differences between the paired and two-sample t-tests. 12.12 Chapter summary. 13. Analyses of variance. going beyond t-tests. 13.1 Extending the complexity of experimental designs. 13.2 One-way analysis of variance. 13.3 Two-way analysis of variance. 13.4 Multi-factorial experiments. 13.5 Keep it simple. Keep it powerful. 13.6 Chapter summary. 14. Correlation and regression. relationships between measured values. 14.1 Correlation analysis. 14.2 Regression analysis. 14.3 Multiple regression. 14.4 Chapter summary. PART 3. NOMINAL-SCALE DATA. 15. Describing categorized data. 15.1 Descriptive statistics. 15.2 Testing whether the population proportion might credibly be some pre-determined figure. 15.3 Chapter summary. 16. Comparing observed proportions. the contingency chi-square test. 16.1 Using the contingency chi-square test to compare observed proportions. 16.2 Obtaining a 95 per cent CI for the change in the proportion of expulsions. is the difference large enough to be of practical significance? 16.3 Larger tables. attendance at diabetic clinics. 16.4 Planning experimental size. 16.5 Chapter summary. PART 4. ORDINAL-SCALE DATA. 17. Ordinal and non-normally distributed data.Transformations and non-parametric tests. 17.1 Transforming data to a normal distribution. 17.2 The Mann-Whitney test. a non-parametric method. 17.3 Dealing with ordinal data. 17.4 Other non-parametric methods. 17.5 Chapter summary. Appendix to Chapter 17. PART 5. SOME CHALLENGES FROM THE REAL WORLD. 18. Multiple testing. 18.1 What is it and why is it a problem? 18.2 Where does multiple testing arise? 18.3 Methods to avoid false positives. 18.4 The role of scientific journals. 18.5 Chapter summary. 19. Questionnaires. 19.1 Is there anything special about questionnaires? 19.2 Types of questions. 19.3 Designing a questionnaire. 19.4 Sample sizes and return rates. 19.5 Analysing the results. 19.6 Confounded epidemiological data. 19.7 Multiple testing with questionnaire data. 19.8 Chapter summary. PART 6. CONCLUSIONS. 20. Conclusions. 20.1 Be clear about the purpose of the experiment. 20.2 Keep the experimental design simple and therefore clear and powerful. 20.3 Draw up a statistical analysis plan as part of the experimental design. it is not a last minute add-on. 20.4 Explore your data visually before launching into statistical testing. 20.5 Beware of multiple analyses. 20.6 Interpret both significance and non-significance with care. Index.
| Erscheint lt. Verlag | 1.5.2007 |
|---|---|
| Verlagsort | Hoboken |
| Sprache | englisch |
| Maße | 167 x 248 mm |
| Gewicht | 540 g |
| Themenwelt | Medizin / Pharmazie ► Medizinische Fachgebiete ► Pharmakologie / Pharmakotherapie |
| Medizin / Pharmazie ► Pharmazie ► Pharmazie Studium | |
| Studium ► Querschnittsbereiche ► Epidemiologie / Med. Biometrie | |
| Naturwissenschaften ► Biologie ► Mikrobiologie / Immunologie | |
| Technik ► Medizintechnik | |
| ISBN-10 | 0-470-03468-8 / 0470034688 |
| ISBN-13 | 978-0-470-03468-2 / 9780470034682 |
| Zustand | Neuware |
| Informationen gemäß Produktsicherheitsverordnung (GPSR) | |
| Haben Sie eine Frage zum Produkt? |
aus dem Bereich


