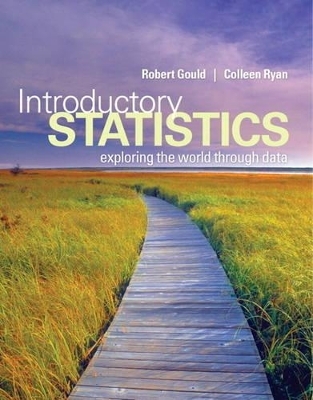
Introductory Statistics
Pearson
978-0-321-32215-9 (ISBN)
- Titel erscheint in neuer Auflage
- Artikel merken
With a clear, unintimidating writing style and carefully chosen pedagogy,Introductory Statistics: Exploring the World through Data makes data analysis accessible to all students. Guided Exercises support students by building their confidence as they learn to solve problems. Snapshots summarize statistical procedures and concepts for convenient studying. While this text assumes the use of statistical software, formulas are presented as an aid to understanding the concepts rather than the focus of study. Check Your Tech features demonstrate how students will get the same numerical value by-hand as when using statistical software.
Robert L. Gould (Ph.D., University of California, San Diego) is a leader in the statistics education community. He has served as chair of the American Statistical Association’s Committee on Teacher Enhancement, has served as chair of the ASA’s Statistics Education Section, and was a co-author of the Guidelines for Assessment in Instruction on Statistics Education (GAISE) College Report. As the associate director of professional development for CAUSE (Consortium for the Advancement of Undergraduate Statistics Education), he has worked closely with the American Mathematical Association of Two-Year Colleges (AMATYC) to provide traveling workshops and summer institutes in statistics (he also presented an AMATYC summer institute in 2009). For over ten years, he has served as Vice-Chair of Undergraduate Studies at the UCLA Department of Statistics, and he is Director of the UCLA Center for the Teaching of Statistics. In 2009, Rob was elected president of the Southern California Chapter of the American Statistical Association. Colleen N. Ryan has taught statistics, chemistry, and physics to diverse community college students for decades. She taught at Oxnard College from 1975 to 2006, where she earned the Teacher of the Year Award. Colleen currently teaches statistics part-time at California Lutheran University. She often designs her own lab activities. Her passion is to discover new ways to make statistical theory practical, easy to understand, and sometimes even fun. Colleen earned a B.A. in physics from Wellesley College, an M.A.T. in physics from Harvard University, and an M.A. in chemistry from Wellesley College. Her first exposure to statistics was with Frederick Mosteller at Harvard. In her spare time, she sings with the Oaks Chamber Singers, has been an avid skier in the past, and enjoys time with her family.
1. Introduction to Data
Case Study: Deadly Cell Phones?
1.1 What Are Data?
1.2 Classifying and Storing Data
1.3 Organizing Categorical Data
1.4 Collecting Data to Understand Causality
Exploring Statistics: Collecting a Table of Different Kinds of Data
2. Picturing Variation with Graphs
Case Study: Student-to-Teacher Ratio at Private and Public Colleges
2.1 Visualizing Variation in Numerical Data
2.2 Summarizing Important Features of a Numerical Distribution
2.3 Visualizing Variation in Categorical Variables
2.4 Summarizing Categorical Distributions
2.5 Interpreting Graphs
Exploring Statistics: Personal Distance
3. Numerical Summaries of Center and Variation
Case Study: Living in a Risky World
3.1 Summaries for Symmetric Distributions
3.2 What's Unusual? The Empirical Rule and z-Scores
3.3 Summaries for Skewed Distributions
3.4 Comparing Measures of Center
3.5 Using Boxplots for Displaying Summaries
Exploring Statistics: Does Reaction Distance Depend on Gender?
4. Regression Analysis: Exploring Associations between Variables
Case Study: Catching Meter Thieves
4.1 Visualizing Variability with a Scatterplot
4.2 Measuring Strength of Association with Correlation
4.3 Modeling Linear Trends
4.4 Evaluating the Linear Model
Exploring Statistics: Guessing the Age of Famous People
5. Modeling Variation with Probability
Case Study: SIDS or Murder?
5.1 What is Randomness?
5.2 Finding Theoretical Probabilities
5.3 Associations in Categorical Variables
5.4 Finding Empirical Probabilities with Simulations
Exploring Statistics: "Let's Make a Deal": Stay or Switch?
6. Modeling Random Events: The Normal and Binomial Models
Case Study: You Sometimes Get More Than You Pay For
6.1 Probability Distributions Are Models of Random Experiments
6.2 The Normal Model
6.3 The Binomial Model
Exploring Statistics: ESP with Coin Flipping
7. Survey Sampling and Inference
Case Study: Spring Break Fever: Just What the Doctors Ordered?
7.1 Learning about the World through Surveys
7.2 Measuring the Quality of a Survey
7.3 The Central Limit Theorem for Sample Proportions
7.4 Estimating the Population Proportion with Confidence Intervals
7.5 Margin of Error and Sample Size for Proportions (Optional)
Exploring Statistics: Simple Random Sampling Prevents Bias
8. Hypothesis Testing for Population Proportions
Case Study: Does Watching Violent TV as a Child Lead to Violent Behavior as an Adult?
8.1 The Main Ingredients of Hypothesis Testing
8.2 Characterizing p-values
8.3 Hypothesis Testing in Four Steps
8.4 Comparing Proportions from Two Populations
8.5 Understanding Hypothesis Testing
Exploring Statistics: Identifying Flavors of Gum through Smell
9. Inferring Population Means
Case Study: Epilepsy Drugs and Children
9.1 Sample Means of Random Samples
9.2 The Central Limit Theorem for Sample Means
9.3 Answering Questions about the Mean of a Population
9.4 Comparing Two Population Means
9.5 Overview of Analyzing Means
Exploring Statistics: Pulse Rates
10. Associations between Categorical Variables
Case Study: Popping Better Popcorn
10.1 The Basic Ingredients for Testing with Categorical Variables
10.2 The Chi-Square Test for Goodness of Fit
10.3 Chi-Square Tests for Associations between Categorical Variables
10.4 Hypothesis Tests When Sample Sizes Are Small
Exploring Statistics: Skittles
11. Multiple Comparisons and Analysis of Variance
Case Study: Seeing Red
11.1 Multiple Comparisons
11.2 The Analysis of Variance
11.3 The ANOVA Test
11.4 Post-Hoc Procedures
Exploring Statistics: Recovery Heart Rate
12. Experimental Design: Controlling Variation
Case Study: Does Stretching Improve Athletic Performance?
12.1 Variation Out of Control
12.2 Controlling Variation in Surveys
12.3 Reading Research Papers
Exploring Statistics: Reporting on Research Activities
13. Inference without Normality
Case Study: Electric Rays
13.1 Transforming Data
13.2 The Sign Test for Paired Data
13.3 Mann-Whitney Test for Two Independent Groups
13.4 Randomization Tests
Exploring Statistics: Balancing on One Foot
14. Inference for Regression
Case Study: Building a Better Oyster Shucker
14.1 The Linear Regression Model
14.2 Using the Linear Model
14.3 Predicting Values and Estimating Means
Exploring Statistics: Older and Slower?
| Erscheint lt. Verlag | 10.2.2012 |
|---|---|
| Sprache | englisch |
| Maße | 216 x 276 mm |
| Gewicht | 1764 g |
| Themenwelt | Schulbuch / Wörterbuch |
| Sozialwissenschaften ► Pädagogik | |
| ISBN-10 | 0-321-32215-0 / 0321322150 |
| ISBN-13 | 978-0-321-32215-9 / 9780321322159 |
| Zustand | Neuware |
| Haben Sie eine Frage zum Produkt? |
aus dem Bereich


