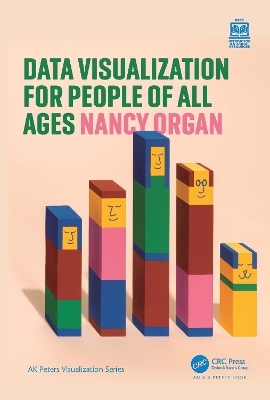
Data Visualization for People of All Ages
Taylor & Francis Ltd (Verlag)
978-1-032-30100-6 (ISBN)
Data visualization is the art and science of making information visible. On paper and in our imaginations, it’s a language of shapes and colors that holds our best ideas and most important questions. As we find ourselves swimming in data of all kinds, visualization can help us to understand, express, and explore the richness of the world around us. No matter your age or background, this book opens the door to new ways of thinking and sharing through the power of data visualization.
Data Visualization for People of All Ages is a field guide to visual literacy, born from the author’s personal experience working with world-class scholars, engineers, and scientists. By walking through the different ways of showing data—including color, angle, position, and length—you’ll learn how charts and graphs truly work so that no visualization is ever a mystery or out of reach. It doesn’t stop at what fits on a page, either. You’ll journey into cutting-edge topics like data sonification and data physicalization, using sound and touch to share data across the different senses. Packed with practical examples and exercises to help you connect the dots, this book will teach you how to create and understand data visualizations on your own—all without writing a single line of code or getting tangled up in software.
Written with accessibility in mind, this book invites everyone to the table to share the joy of one of today’s most necessary skills. Perfect for home or classroom use, this friendly companion gives people of all ages everything they need to start visualizing with confidence.
Nancy Organ is a Seattle-based data visualization professional with experience in research, education, and tech, including contributions at Microsoft and the University of Washington. She holds a degree in Statistics from the University of California, Berkeley. Endeavoring to make visualization accessible, fun, and empowering for young people and adults alike, she packs nearly a decade of visualization design experience into one light-hearted book.
Series editor foreword. About the author. Welcome! 1 What is data? 2 What is data visualization? 3 Length and height. 4 Size and area. 5 Position. 6 Color for categorical data. 7 Color for numerical data. 8 Color for ordinal data. 9 Shapes and patterns. 10 Making colorblind‑friendly visualizations. 11 Angle. 12 Connections and networks. 13 Visualization whoopsies. 14 Sound and touch. 15 Wrapping up. Appendix 1 – Glossary of words. Appendix 2 – Glossary of graphs. Appendix 3 – Solutions guide. Bibliography. Acknowledgments. Index.
| Erscheinungsdatum | 26.04.2024 |
|---|---|
| Reihe/Serie | AK Peters Visualization Series |
| Zusatzinfo | 67 Tables, color; 180 Line drawings, color; 47 Line drawings, black and white; 113 Halftones, color; 293 Illustrations, color; 47 Illustrations, black and white |
| Verlagsort | London |
| Sprache | englisch |
| Maße | 178 x 254 mm |
| Gewicht | 701 g |
| Themenwelt | Schulbuch / Wörterbuch |
| Mathematik / Informatik ► Informatik ► Datenbanken | |
| Mathematik / Informatik ► Informatik ► Programmiersprachen / -werkzeuge | |
| Mathematik / Informatik ► Informatik ► Software Entwicklung | |
| Mathematik / Informatik ► Informatik ► Theorie / Studium | |
| ISBN-10 | 1-032-30100-7 / 1032301007 |
| ISBN-13 | 978-1-032-30100-6 / 9781032301006 |
| Zustand | Neuware |
| Informationen gemäß Produktsicherheitsverordnung (GPSR) | |
| Haben Sie eine Frage zum Produkt? |
aus dem Bereich


