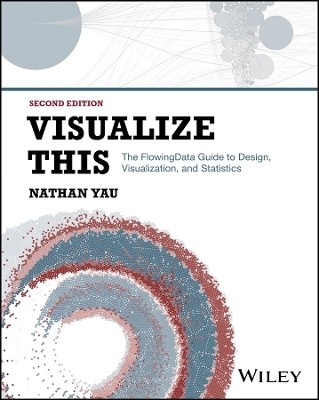
Visualize This
John Wiley & Sons Inc (Verlag)
978-1-394-21486-0 (ISBN)
Visualize This demonstrates how to explain data visually, so that you can present and communicate information in a way that is appealing and easy to understand. Today, there is a continuous flow of data available to answer almost any question. Thoughtful charts, maps, and analysis can help us make sense of this data. But the data does not speak for itself. As leading data expert Nathan Yau explains in this book, graphics provide little value unless they are built upon a firm understanding of the data behind them. Visualize This teaches you a data-first approach from a practical point of view. You'll start by exploring what your data has to say, and then you'll design visualizations that are both remarkable and meaningful.
With this book, you'll discover what tools are available to you without becoming overwhelmed with options. You'll be exposed to a variety of software and code and jump right into real-world datasets so that you can learn visualization by doing. You'll learn to ask and answer questions with data, so that you can make charts that are both beautiful and useful. Visualize This also provides you with opportunities to apply what you learn to your own data. This completely updated, full-color second edition:
Presents a unique approach to visualizing and telling stories with data, from data visualization expert Nathan Yau
Offers step-by-step tutorials and practical design tips for creating statistical graphics, geographical maps, and information design
Details tools that can be used to visualize data graphics for reports, presentations, and stories, for the web or for print, with major updates for the latest R packages, Python libraries, JavaScript libraries, illustration software, and point-and-click applications
Contains numerous examples and descriptions of patterns and outliers and explains how to show them
Information designers, analysts, journalists, statisticians, data scientists—as well as anyone studying for careers in these fields—will gain a valuable background in the concepts and techniques of data visualization, thanks to this legendary book.
Nathan Yau earned his PhD in Statistics at UCLA. His goal is to make data available and useful to everyone, regardless of data background. He believes that visualization is the best way to do this. You can follow his data experiments at www.flowingdata.com.
Introduction xv
1 Telling Stories with Data 1
More than Numbers 2
Ask Questions About the Data 8
Design 14
Wrapping Up 20
2 Choosing Tools to Visualize Data 21
Mixed Toolbox 22
Point- and- Click Visualization 23
Programming 31
Mapping 40
Illustration 45
Small Visualization Tools 49
Pencil and Paper 54
Survey Your Options 55
Wrapping Up 57
3 Handling Data 59
Data Preparations 60
Finding Data 60
Collecting Data 65
Loading Data 73
Formatting Data 74
Processing Data 86
Filtering and Aggregating Sampled Data 87
Wrapping Up 89
4 Visualizing Time 91
Trends 92
Events 112
Cycles 131
Wrapping Up 141
5 Visualizing Categories 143
Amounts 144
Parts of a Whole 159
Rank and Order 176
Categories and Time 180
Wrapping Up 192
6 Visualizing Relationships 193
Correlation 194
Differences 212
Multiple Variables 225
Connections 235
Wrapping Up 243
7 Visualizing Space 245
Working with Spatial Data 246
Locations 250
Spatial Distributions 266
Space and Time 283
Wrapping Up 293
8 Analyzing Data Visually 295
Gathering Information 296
Overviews 296
Exploring Details 324
Drawing Conclusions 336
Wrapping Up 337
9 Designing with Purpose 339
Good Visualization 340
Insight for Others 344
Wrapping Up 351
Index 353
| Erscheinungsdatum | 23.05.2024 |
|---|---|
| Verlagsort | New York |
| Sprache | englisch |
| Maße | 185 x 234 mm |
| Gewicht | 748 g |
| Themenwelt | Informatik ► Office Programme ► Outlook |
| Informatik ► Software Entwicklung ► User Interfaces (HCI) | |
| ISBN-10 | 1-394-21486-3 / 1394214863 |
| ISBN-13 | 978-1-394-21486-0 / 9781394214860 |
| Zustand | Neuware |
| Informationen gemäß Produktsicherheitsverordnung (GPSR) | |
| Haben Sie eine Frage zum Produkt? |
aus dem Bereich


