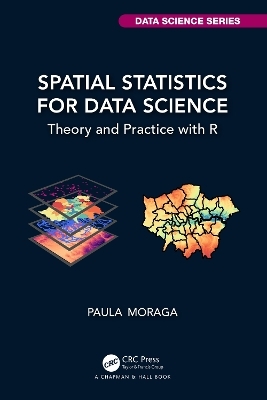
Spatial Statistics for Data Science
Chapman & Hall/CRC (Verlag)
978-1-032-63351-0 (ISBN)
Spatial data is crucial to improve decision-making in a wide range of fields including environment, health, ecology, urban planning, economy, and society. Spatial Statistics for Data Science: Theory and Practice with R describes statistical methods, modeling approaches, and visualization techniques to analyze spatial data using R. The book provides a comprehensive overview of the varying types of spatial data, and detailed explanations of the theoretical concepts of spatial statistics, alongside fully reproducible examples which demonstrate how to simulate, describe, and analyze spatial data in various applications. Combining theory and practice, the book includes real-world data science examples such as disease risk mapping, air pollution prediction, species distribution modeling, crime mapping, and real state analyses. The book utilizes publicly available data and offers clear explanations of the R code for importing, manipulating, analyzing, and visualizing data, as well as the interpretation of the results. This ensures contents are easily accessible and fully reproducible for students, researchers, and practitioners.
Key Features:
Describes R packages for retrieval, manipulation, and visualization of spatial data.
Offers a comprehensive overview of spatial statistical methods including spatial autocorrelation, clustering, spatial interpolation, model-based geostatistics, and spatial point processes.
Provides detailed explanations on how to fit and interpret Bayesian spatial models using the integrated nested Laplace approximation (INLA) and stochastic partial differential equation (SPDE) approaches.
Paula Moraga is Professor of Statistics at King Abdullah University of Science and Technology (KAUST). She received her Master's in Biostatistics from Harvard University and her Ph.D. in Mathematics from the University of Valencia. Dr. Moraga develops innovative statistical methods and open-source software for spatial data analysis and health surveillance, including R packages for spatio-temporal modeling, detection of clusters, and travel-related spread of disease. Her work has directly informed strategic policy in reducing the burden of diseases such as malaria and cancer in several countries. Dr. Moraga has published extensively in leading journals, and serves as an Associate Editor of the Journal of the Royal Statistical Society Series A. She is the author of the book Geospatial Health Data: Modeling and Visualization with R-INLA and Shiny (Chapman & Hall/CRC). Dr. Moraga received the prestigious Letten Prize for her pioneering research in disease surveillance, and her significant contributions to the development of sustainable solutions for health and environment globally.
Part 1: Spatial data 1. Types of spatial data 2. Spatial data in R 3. The sf package for spatial vector data 4. The terra package for raster and vector data 5. Making maps with R 6. R packages to download open spatial data Part 2: Areal data 7. Spatial neighborhood matrices 8. Spatial autocorrelation 9. Bayesian spatial models 10. Disease risk modeling 11. Areal data issues Part 3: Geostatistical data 12. Geostatistical data 13. Spatial interpolation methods 14. Kriging 15. Model-based geostatistics 16. Methods assessment Part 4: Spatial point patterns 17. Spatial point patterns 18. The spatstat package 19. Spatial point processes and simulation 20. Complete Spatial Randomness 21. Intensity estimation 22. The K-function 23. Point process modeling Appendix A. The R software
| Erscheinungsdatum | 12.12.2023 |
|---|---|
| Reihe/Serie | Chapman & Hall/CRC Data Science Series |
| Zusatzinfo | 83 Line drawings, color; 41 Line drawings, black and white; 3 Halftones, color; 1 Halftones, black and white; 86 Illustrations, color; 42 Illustrations, black and white |
| Sprache | englisch |
| Maße | 156 x 234 mm |
| Gewicht | 600 g |
| Themenwelt | Mathematik / Informatik ► Mathematik ► Computerprogramme / Computeralgebra |
| Mathematik / Informatik ► Mathematik ► Statistik | |
| Naturwissenschaften ► Biologie | |
| Naturwissenschaften ► Geowissenschaften ► Geologie | |
| ISBN-10 | 1-032-63351-4 / 1032633514 |
| ISBN-13 | 978-1-032-63351-0 / 9781032633510 |
| Zustand | Neuware |
| Haben Sie eine Frage zum Produkt? |
aus dem Bereich


