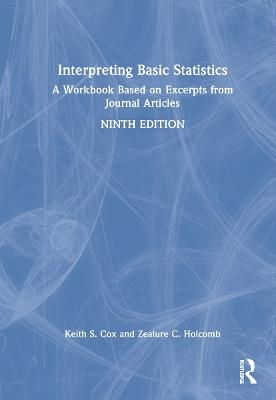
Interpreting Basic Statistics
A Workbook Based on Excerpts from Journal Articles
Seiten
2021
|
9th edition
Routledge (Verlag)
978-0-367-56051-5 (ISBN)
Routledge (Verlag)
978-0-367-56051-5 (ISBN)
Interpreting Basic Statistics gives students valuable practice in interpreting statistical reporting as it actually appears in peer-reviewed journals.
Features of the ninth edition:
• Covers a broad array of basic statistical concepts, including topics drawn from the New Statistics
• Up-to-date journal excerpts reflecting contemporary styles in statistical reporting
• Strong emphasis on data visualization
• Ancillary materials include data sets with almost two hours of accompanying tutorial videos, which will help students and instructors apply lessons from the book to real-life scenarios
About this book
Each of the 63 exercises in the book contain three central components: 1) an introduction to a statistical concept, 2) a brief excerpt from a published research article that uses the statistical concept, and 3) a set of questions (with answers) that guides students into deeper learning about the concept. The questions on the journal excerpts promote learning by helping students
• interpret information in tables and figures,
• perform simple calculations to further their interpretations,
• critique data-reporting techniques, and
• evaluate procedures used to collect data.
The questions in each exercise are divided into two parts: (1) Factual Questions and (2) Questions for Discussion. The Factual Questions require careful reading for details, while the discussion questions show that interpreting statistics is more than a mathematical exercise. These questions require students to apply good judgment as well as statistical reasoning in arriving at appropriate interpretations. Each exercise covers a limited number of topics, making it easy to coordinate the exercises with lectures or a traditional statistics textbook.
Keith S. Cox is a Clinical and Personality Psychologist. He teaches research methods and statistics at the University of North Carolina Asheville, where he holds the rank of assistant professor. He uses the research methods and statistics covered in this book as he investigates Posttraumatic Stress Disorder (PTSD) and personality.
1. Basic Descriptions of the Data: Measurement and Frequency 2. Describing the Data 3. Displaying Data: Visualizing What is There 4. Finding Relationships: Association and Prediction 5. Group Differences with Normal Distributions 6. Nonparametric Tests for Group Differences 7. Test Construction
| Erscheinungsdatum | 01.10.2021 |
|---|---|
| Zusatzinfo | 44 Tables, black and white; 18 Line drawings, black and white; 18 Illustrations, black and white |
| Verlagsort | London |
| Sprache | englisch |
| Maße | 178 x 254 mm |
| Gewicht | 453 g |
| Themenwelt | Geisteswissenschaften ► Psychologie |
| Mathematik / Informatik ► Mathematik ► Statistik | |
| ISBN-10 | 0-367-56051-8 / 0367560518 |
| ISBN-13 | 978-0-367-56051-5 / 9780367560515 |
| Zustand | Neuware |
| Informationen gemäß Produktsicherheitsverordnung (GPSR) | |
| Haben Sie eine Frage zum Produkt? |
Mehr entdecken
aus dem Bereich
aus dem Bereich
Eine Einführung für Wirtschafts- und Sozialwissenschaftler
Buch | Softcover (2022)
De Gruyter Oldenbourg (Verlag)
CHF 41,90


