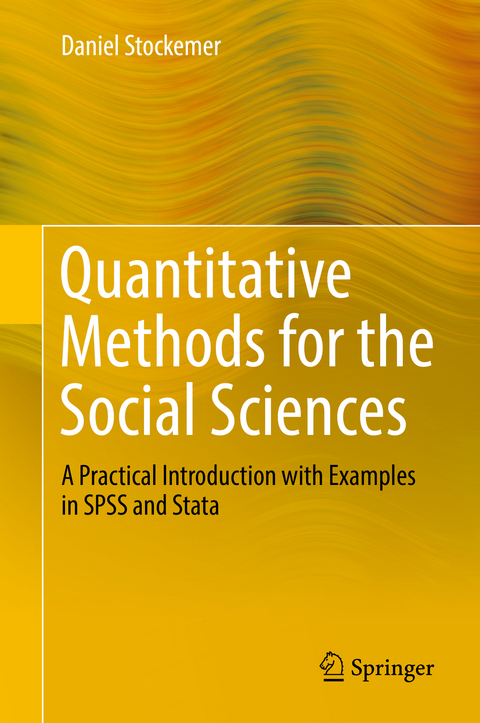
Quantitative Methods for the Social Sciences
Springer International Publishing (Verlag)
978-3-319-99117-7 (ISBN)
- Titel erscheint in neuer Auflage
- Artikel merken
In detail, the textbook introduces students to the four pillars of survey research and quantitative analysis: (1) the importance of survey research, (2) preparing a survey, (3) conducting a survey and (4) analyzing a survey. Students are shown how to create their own questionnaire based on some theoretically derived hypotheses to achieve empirical findings for a solid dataset. Lastly, they use said data to test their hypotheses in a bivariate and multivariate realm.
The book explains the theory, rationale and mathematical foundations of these tests. In addition, it provides clear instructions on how to conduct the tests in SPSS and Stata. Given the breadth of its coverage, the textbook is suitable for introductory statistics, survey research or quantitative methods classes in the social sciences.
Daniel Stockemer is an Associate Professor at the School of Political Studies of the University of Ottawa, Canada. His main research interests are political participation, political representation, right-wing extremism in Europe, as well as quantitative and qualitative research methods. Since becoming a professor in 2010, Stockemer has published 2 single authored books, 1 edited volume and more than 70 articles in peer-reviewed journals. He is also a co-editor of European Political Science (EPS), the professional journal of the European Consortium for Political Research (ECPR).
Chapter 1: Introduction Chapter 2: The nuts and bolts of empirical social science 2.1 What is empirical research in the social sciences? 2.2 Qualitative and quantitative research 2.3 Theories, concepts, variables and hypotheses 2.3.1 Theories 2.3.2 Concepts 2.3.3. Variables 2.3.4 Hypotheses 2.4 The quantitative research process Chapter 3: A short introduction to survey research 3.1 What is survey research? 3.2 A short history of survey research 3.3 The importance of survey research in the social sciences and beyond 3.4 Overview of some of the most widely-used surveys in the social sciences 3.4.1 The Comparative Study of Electoral Systems (CSES) 3.4.2 World Value Survey (WVS) 3.4.3 The European Social Survey (ESS) 3.5 Different types of surveys 3.5.1 Cross-sectional surveys 3.5.2 Longitudinal surveys Chapter 4: Constructing a survey 4.1 Question design 4.2 Ordering of questions 4.3 Number of questions 4.4 Getting the questions right 4.5 Social desirability 4.6 Open-ended and closed-ended questions 4.7 Types of closed-ended survey questions 4.7.1 Scales 4.7.2 Dichotomous survey questions 4.7.3 Multiple choice questions 4.7.4 Numerical continuous questions 4.7.5 Categorical survey questions 4.7.6 Rank order questions 4.7.7 Matrix table questions 4.8 Different variables 4.9 Coding of different variables in a dataset 4.9.1 Coding of nominal variables
4.10 Drafting a questionnaire: General information 4.10.1 Drafting a questionnaire A step-by-step approach 4.11 Sample questionnaire 4.12 Background information about the questionnaire Chapter 5: Conducting a survey 5.1 Population and sample 5.2 Representative, random, and biased samples 5.3 Sampling errors 5.4 Non-random sampling techniques 5.5 Different types of surveys 5.6 Which type of survey should researchers use? 5.7 Pre-tests 5.7.1 What is a pre-test? 5.7.2 How to conduct a pre-test Chapter 6: Univariate statistics 6.1 SPSS and Stata 6.2 Putting data into an SPSS spreadsheet 6.3 Putting data into a Stata spreadsheet 6.4 Frequency tables 6.4.1 Constructing a frequency table in SPSS 6.4.2 Constructing a frequency table in Stata 6.5 The measures of central tendency - mean, median, mode, and range 6.6 Displaying data graphically - pie charts, boxplots, and histograms 6.6.1 Pie charts 6.6.2 Doing a pie chart in SPSS 6.6.3 Doing a pie chart in Stata 6.7 Boxplots 6.7.1 Doing a boxplot in SPSS 6.7.2 Doing a boxplot in Stata 6.8 Histograms 6.8.1 Doing a histogram in SPSS 6.8.2 Doing a histogram in Stata 6.9 Deviation, variance, standard deviation, standard error, sampling error, and confidence interval 6.9.1 Calculating the confidence interval in SPSS 6.9.2 Calculating the confidence interval in Stata Chapter 7: Bivariate statistics with categorical variables 7.1 Independent samples t-test 7.1.1 Doing an independent samples t-test in SPSS 7.1.2 Interpreting an independent samples t-test SPSS output 7.1.3 Reading an SPSS independent samples t-test output column by column
7.1.4 Doing an independent samples t-test in Stata 7.1.5 Interpreting an independent samples t-test Stata output 7.1.6 Reporting the output of an independent samples t-test 7.2 F-test or one way anova 7.2.1 Doing an f-test in SPSS 7.2.2 Interpreting an SPSS anova output 7.2.3 Doing a post-hoc or multiple comparison test in SPSS 7.2.4 Doing an f-test in Stata 7.2.5 Interpreting an f-test in Stata 7.2.6 Doing a post-hoc or multiple comparison test with unequal variance in Stata 7.2.7 Reporting the results of an f-test 7.3 Cross-tabulation table and chi-square test 7.3.1 Cross-tabulation table 7.3.2 Chi-square test 7.3.3 Doing a chi-square test in SPSS 7.3.4 Interpreting a SPSS chi-square test 7.3.5 Doing a chi-square test in Stata 7.3.6 Reporting a chi-square test result Chapter 8: Bivariate relationships featuring two continuous variables 8.1 What is a bivariate relationship between two continuous variables? 8.1.1 Positive and negative relationships 8.2 Scatterplots 8.2.1 Positive relationships displayed in a scatterplo
"There are many books designed to introduce undergraduate students to elementary statistical analysis, several of which are appropriate for social and behavioural science students. Often lacking in these books is attention to key pre-analysis stages, such as understanding the role of theories, concepts, hypotheses, variables, and survey design and administration. This text provides such pre-analysis information ... . Summing Up: Recommended. Undergraduates." (J. P. Hoffmann, Choice, Vol. 56 (12), August, 2019)
“There are many books designed to introduce undergraduate students to elementary statistical analysis, several of which are appropriate for social and behavioural science students. Often lacking in these books is attention to key pre-analysis stages, such as understanding the role of theories, concepts, hypotheses, variables, and survey design and administration. This text provides such pre-analysis information … . Summing Up: Recommended. Undergraduates.” (J. P. Hoffmann, Choice, Vol. 56 (12), August, 2019)
| Erscheinungsdatum | 06.12.2018 |
|---|---|
| Zusatzinfo | IX, 181 p. 120 illus., 93 illus. in color. |
| Verlagsort | Cham |
| Sprache | englisch |
| Maße | 155 x 235 mm |
| Gewicht | 456 g |
| Themenwelt | Mathematik / Informatik ► Mathematik ► Computerprogramme / Computeralgebra |
| Sozialwissenschaften ► Soziologie ► Empirische Sozialforschung | |
| Schlagworte | Introductory Statistics • Practical Approach to Survey Research • Quantitative Methods in Social Sciences • SPSS • Stata • Statistics in social sciences |
| ISBN-10 | 3-319-99117-5 / 3319991175 |
| ISBN-13 | 978-3-319-99117-7 / 9783319991177 |
| Zustand | Neuware |
| Haben Sie eine Frage zum Produkt? |
aus dem Bereich


