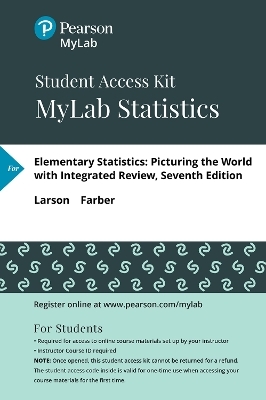
MyLab Statistics with Pearson eText (up to 24 months) Access Code for Elementary Statistics
Pearson (Hersteller)
978-0-13-476199-2 (ISBN)
- Titel z.Zt. nicht lieferbar
- Versandkostenfrei
- Auch auf Rechnung
- Artikel merken
This title-specific access card provides access to the Larson/Farber, Elementary Statistics: Picturing the World, 7/e accompanying MyLab course ONLY.
013478362X / 9780134783628 MYLAB STATISTICS WITH PEARSON ETEXT -- STANDALONE ACCESS CARD -- FOR ELEMENTARY STATISTICS: PICTURING THE WORLD, 7/e
MyLab Statistics is the world's leading online tutorial, and assessment program designed to help you learn and succeed in your mathematics course. MyLab Statistics online courses are created to accompany one of Pearson's best-selling math textbooks. Every MyLab Statistics course includes a complete, interactive eText. Learn more about MyLab Statistics.
ALERT: Before you purchase, check with your instructor or review your course syllabus to ensure that you select the correct ISBN.
Used or rental books If you rent or purchase a used book with an access code, the access code may have been redeemed previously and you may have to purchase a new access code. Access codes Access codes that are purchased from sellers other than Pearson carry a higher risk of being either the wrong ISBN or a previously redeemed code. Check with the seller prior to purchase.
About our authors Ron Larson received his Ph.D. in mathematics from the University of Colorado in 1970. At that time he accepted a position with Penn State University, and he currently holds the rank of professor of mathematics at the university. Larson is the lead author of more than two dozen mathematics textbooks that range from 6th grade through calculus levels. Many of his texts, such as the 10th Edition of his calculus text, are leaders in their markets. Larson is also one of the pioneers in the use of multimedia and the Internet to enhance the learning of mathematics. He has authored multimedia programs, extending from the elementary school through calculus levels. Larson is a member of several professional groups and is a frequent speaker at national and regional mathematics meetings. Many thanks to Betsy Farber for her significant contributions to previous editions of the text. Sadly, Betsy passed away in 2013. She received her Bachelor's degree in mathematics from Penn State University and her Master's degree in mathematics from the College of New Jersey. Betsy taught all levels of mathematics at Bucks County Community College in Newtown, Pennsylvania for many years. She made many notable contributions throughout her career to developing new ways to make statistics relevant and interesting for both online and traditional students.
I. DESCRIPTIVE STATISTICS
Introduction to Statistics
1.1 An Overview of Statistics
1.2 Data Classification
1.3 Data Collection and Experimental Design
Descriptive Statistics
2.1 Frequency Distributions and Their Graphs
2.2 More Graphs and Displays
2.3 Measures of Central Tendency
2.4 Measures of Variation
2.5 Measures of Position
II. PROBABILITY AND PROBABILITY DISTRIBUTIONS
Probability
3.1 Basic Concepts of Probability and Counting
3.2 Conditional Probability and the Multiplication Rule
3.3 The Addition Rule
3.4 Additional Topics in Probability and Counting
Discrete Probability Distributions
4.1 Probability Distributions
4.2 Binomial Distributions
4.3 More Discrete Probability Distributions
Normal Probability Distributions
5.1 Introduction to Normal Distributions and the Standard Normal Distribution
5.2 Normal Distributions: Finding Probabilities
5.3 Normal Distributions: Finding Values
5.4 Sampling Distributions and the Central Limit Theorem
5.5 Normal Approximations to Binomial Distributions
III. STATISTICAL INFERENCE
Confidence Intervals
6.1 Confidence Intervals for the Mean (S Known)
6.2 Confidence Intervals for the Mean (S Unknown)
6.3 Confidence Intervals for Population Proportions
6.4 Confidence Intervals for Variance and Standard Deviation
Hypothesis Testing with One Sample
7.1 Introduction to Hypothesis Testing
7.2 Hypothesis Testing for the Mean (S Known)
7.3 Hypothesis Testing for the Mean (S Unknown)
7.4 Hypothesis Testing for Proportions
7.5 Hypothesis Testing for Variance and Standard Deviation
Hypothesis Testing with Two Samples
8.1 Testing the Difference Between Means (Independent Samples, S1 and S2 Known)
8.2 Testing the Difference Between Means (Independent Samples, S1 and S2 Unknown)
8.3 Testing the Difference Between Means (Dependent Samples)
8.4 Testing the Difference Between Proportions
IV. MORE STATISTICAL INFERENCE
Correlation and Regression
9.1 Correlation
9.2 Linear Regression
9.3 Measures of Regression and Prediction Intervals
9.4 Multiple Regression
Chi-Square Tests and the F-Distribution
10.1 Goodness-of-Fit Test
10.2 Independence
10.3 Comparing Two Variances
10.4 Analysis of Variance
Nonparametric Tests (Web Only)*
11.1 The Sign Test
11.2 The Wilcoxon Tests
11.3 The Kruskal-Wallis Test
11.4 Rank Correlation
11.5 The Runs Test
* Available at www.pearson.com/math-stats-resources and in MyLab Statistics.
APPENDICES
A. Alternative Presentation of the Standard Normal Distribution
B. Tables
C. Normal Probability Plots
| Sprache | englisch |
|---|---|
| Maße | 150 x 221 mm |
| Gewicht | 22 g |
| Themenwelt | Mathematik / Informatik ► Mathematik ► Statistik |
| ISBN-10 | 0-13-476199-5 / 0134761995 |
| ISBN-13 | 978-0-13-476199-2 / 9780134761992 |
| Zustand | Neuware |
| Haben Sie eine Frage zum Produkt? |
aus dem Bereich
