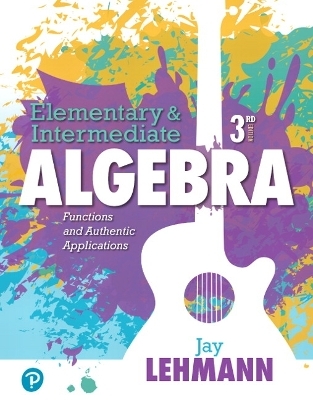
Elementary & Intermediate Algebra
Pearson (Verlag)
978-0-13-475697-4 (ISBN)
Modeling authentic data through curve-fitting gives students new meaning to the math
Seeking the answer to students’ perennial question “But what is this good for?” the Lehmann Algebra Series uses authentic, real-life data sets to find models and derive equations that fit the scenario. The curve-fitting approach teaches the mathematical concepts within the context of data, getting students engaged from the start and building conceptual understanding.
Updates in this revision keep the data sets authentic and current, and provide even more resources for students to practice, review, and explore the concepts.
Also available with MyLab Math
By combining trusted author content with digital tools and a flexible platform, MyLab™ personalizes the learning experience and improves results for each student.
Note: You are purchasing a standalone product; MyLab Math does not come packaged with this content. Students, if interested in purchasing this title with MyLab Math, ask your instructor to confirm the correct package ISBN and Course ID. Instructors, contact your Pearson representative for more information.
If you would like to purchase both the physical text and MyLab Math, search for:
0134776070 / 9780134776071 Elementary & Intermediate Algebra: Functions and Authentic Applications Plus MyLab Math -- Access Card Package, 3/e
Package consists of:
0134756975 / 9780134756974 Elementary & Intermediate Algebra: Functions and Authentic Applications
013478118X / 9780134781181 MyLab Math with Pearson eText - Standalone Access Card - for Elementary & Intermediate Algebra: Functions and Authentic Applications
About our author Jay Lehmann has taught for the past 25 years at College of San Mateo, where he received the “shiny apple award” for excellence in teaching. He has presented at over 80 conferences including AMATYC and ICTCM over the past 16 years. Jay is currently the newsletter editor for California Mathematics Council, Community Colleges (CMC3). Still young at heart, he plays in a rock band appropriately named the Procrastinistas. Jay has authored several algebra textbooks published by Pearson and has also recently completed a Prestatistics textbook. In the words of the author: “Before writing my algebra series, it was painfully apparent that my students couldn't relate to the applications in the course. I was plagued with the question, "What is this good for?" To try to bridge that gap, I wrote some labs, which facilitated my students in collecting data, finding models via curve fitting, and using the models to make estimates and predictions. My students really loved working with the current, compelling, and authentic data and experiencing how mathematics truly is useful. “My students' response was so strong that I decided to write an algebra series. Little did I know that to realize this goal, I would need to embark on a 15-year challenging journey, but the rewards of hearing such excitement from students and faculty across the country have made it all worthwhile! I'm proud to have played even a small role in raising people’s respect and enthusiasm for mathematics. “I have tried to honor my inspiration: by working with authentic data, students can experience the power of mathematics. A random-sample study at my college suggests that I am achieving this goal. The study concludes that students who used my series were more likely to feel that mathematics would be useful in their lives (P-value 0.0061) as well as their careers (P-value 0.024). “The series is excellent preparation for subsequent courses; in particular, because of the curve fitting and emphasis on interpreting the contextual meaning of parameters, it is an ideal primer for statistics. In addition to curve fitting, my approach includes other types of meaningful modeling, directed-discovery explorations, conceptual questions, and of course, a large bank of skill problems. The curve-fitting applications serve as a portal for students to see the usefulness of mathematics so that they become fully engaged in the class. Once involved, they are more receptive to all aspects of the course.”
Introduction to Modeling
1.1 Variables and Constants
1.2 Scatterplots
1.3 Exact Linear Relationships
1.4 Approximate Linear Relationships
Taking It to the Lab: Climate Change Lab • Volume Lab • Linear Graphing Lab: Topic of Your Choice
Operations and Expressions
2.1 Expressions
2.2 Operations with Fractions
2.3 Absolute Value and Adding Real Numbers
2.4 Change in a Quantity and Subtracting Real Numbers
2.5 Ratios, Percents, and Multiplying and Dividing Real Numbers
2.6 Exponents and Order of Operations
Taking It to the Lab: Climate Change Lab (continued from Chapter 1) • Stocks Lab
Using Slope to Graph Linear Equations
3.1 Graphing Equations of the Forms y = mx + b and x = a
3.2 Graphing Linear Models; Unit Analysis
3.3 Slope of a Line
3.4 Using Slope to Graph Linear Equations
3.5 Rate of Change
Taking It to the Lab: Climate Change Lab (continued from Chapter 2) • Workout Lab • Balloon Lab
Simplifying Expressions and Solving Equations
4.1 Simplifying Expressions
4.2 Simplifying More Expressions
4.3 Solving Linear Equations in One Variable
4.4 Solving More Linear Equations in One Variable
4.5 Comparing Expressions and Equations
4.6 Formulas
Linear Functions and Linear Inequalities in One Variable
5.1 Graphing Linear Equations
5.2 Functions
5.3 Function Notation
5.4 Finding Linear Equations
5.5 Finding Equations of Linear Models
5.6 Using Function Notation with Linear Models to Make Estimates and Predictions
5.7 Solving Linear Inequalities in One Variable
Taking It to the Lab: Climate Change Lab (continued from Chapter 3) • Golf Ball Lab • Rope Lab • Shadow Lab • Linear Lab: Topic of Your Choice
Systems of Linear Equations and Systems of Linear Inequalities
6.1 Using Graphs and Tables to Solve Systems
6.2 Using Substitution to Solve Systems
6.3 Using Elimination to Solve Systems
6.4 Using Systems to Model Data
6.5 Perimeter, Value, Interest, and Mixture Problems
6.6 Linear Inequalities in Two Variables; Systems of Linear Inequalities in Two Variables
Taking It to the Lab: Climate Change Lab (continued from Chapter 5) • Sports Lab • Truck Lab
Polynomial Functions and Properties of Exponents
7.1 Adding and Subtracting Polynomial Expressions and Functions
7.2 Multiplying Polynomial Expressions and Functions
7.3 Powers of Polynomials; Product of Binomial Conjugates
7.4 Properties of Exponents
7.5 Dividing Polynomials: Long Division and Synthetic Division
Taking It to the Lab: Climate Change Lab (continued from Chapter 6) • Projectile Lab
Factoring Polynomials and Solving Polynomial Equations
8.1 Factoring Trinomials of the Form x2 + bx + c and Differences of Two Squares
8.2 Factoring Out the GCF; Factoring by Grouping
8.3 Factoring Trinomials of the Form ax2 + bx + c
8.4 Sums and Differences of Cubes; A Factoring Strategy
8.5 Using Factoring to Solve Polynomial Equations
8.6 Using Factoring to Make Predictions with Quadratic Models
Quadratic Functions
9.1 Graphing Quadratic Functions in Vertex Form
9.2 Graphing Quadratic Functions in Standard Form
9.3 Simplifying Radical Expressions
9.4 Using the Square Root Property to Solve Quadratic Equations
9.5 Solving Quadratic Equations by Completing the Square
9.6 Using the Quadratic Formula to Solve Quadratic Equations
9.7 Solving Systems of Linear Equations in Three Variables; Finding Quadratic Functions
9.8 Finding Quadratic Models
9.9 Modeling with Quadratic Functions
Taking It to the Lab: Climate Change Lab (continued from Chapter 7) • Projectile Lab (continued from Chapter 7) • Projectile Lab (Using a CBR or CBL) • Water Flow Lab • Quadratic Lab: Topic of Your Choice
Exponential Functions
10.1 Integer Exponents
10.2 Rational Exponents
10.3 Graphing Exponential Functions
10.4 Finding Equations of Exponential Functions
10.5 Using Exponential Functions to Model Data
Taking It to the Lab: Stringed Instrument Lab • Cooling Water Lab • Exponential Lab: Topic of Your Choice
Logarithmic Functions
11.1 Composite Functions
11.2 Inverse Functions
11.3 Logarithmic Functions
11.4 Properties of Logarithms
11.5 Using the Power Property with Exponential Models to Make Predictions
11.6 More Properties of Logarithms
11.7 Natural Logarithms
Taking It to the Lab: China and India Populations Lab • Folding Paper Lab • Exponential/Logarithmic Lab:
Topic of Your Choice
Rational Functions
12.1 Finding the Domains of Rational Functions and Simplifying Rational Expressions
12.2 Multiplying and Dividing Rational Expressions; Converting Units
12.3 Adding and Subtracting Rational Expressions
12.4 Simplifying Complex Rational Expressions
12.5 Solving Rational Equations
12.6 Modeling with Rational Functions
12.7 Proportions; Similar Triangles
12.8 Variation
Taking It to the Lab: Climate Change Lab (continued from Chapter 9) • Illumination Lab • Boyle’s Law Lab • Estimating 5 Lab
Radical Functions
13.1 Simplifying Radical Expressions
13.2 Adding, Subtracting, and Multiplying Radical Expressions
13.3 Rationalizing Denominators and Simplifying Quotients of Radical Expressions
13.4 Graphing and Combining Square Root Functions
13.5 Solving Radical Equations
13.6 Modeling with Square Root Functions
Taking It to the Lab: Pendulum Lab
Sequences and Series
14.1 Arithmetic Sequences
14.2 Geometric Sequences
14.3 Arithmetic Series
14.4 Geometric Series
Taking It to the Lab: Bouncing Ball Lab • Stacked Cups Lab
Additional Topics
15.1 Absolute Value: Equations and Inequalities
15.2 Performing Operations with Complex Numbers
15.3 Pythagorean Theorem, Distance Formula, and Circles
15.4 Ellipses and Hyperbolas
15.5 Solving Nonlinear Systems of Equations
APPENDICES
A. Using a TI-83 or TI-84 Graphing Calculator
B. Using StatCrunch
| Erscheinungsdatum | 02.02.2018 |
|---|---|
| Sprache | englisch |
| Maße | 224 x 279 mm |
| Gewicht | 2200 g |
| Themenwelt | Mathematik / Informatik ► Mathematik ► Algebra |
| ISBN-10 | 0-13-475697-5 / 0134756975 |
| ISBN-13 | 978-0-13-475697-4 / 9780134756974 |
| Zustand | Neuware |
| Informationen gemäß Produktsicherheitsverordnung (GPSR) | |
| Haben Sie eine Frage zum Produkt? |
aus dem Bereich


