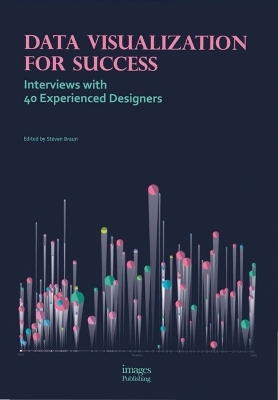
Data Visualization for Success
Interviews with 40 Experienced Designers
Seiten
2017
Images Publishing Group Pty Ltd (Verlag)
978-1-86470-720-5 (ISBN)
Images Publishing Group Pty Ltd (Verlag)
978-1-86470-720-5 (ISBN)
Top designers discuss their approaches to data visualisation, offering insight into their design methods and tips for new practitioners in the field.
What is data visualisation? In Data Visualization for Success, 40 designers and their works demonstrate that data visualisation is a vibrant and constantly evolving field that is as multimodal as it is interdisciplinary. Through the works showcased here, these designers discuss some of their approaches to working with data visualisation, offering insight into the design methods they commonly use and providing tips that will help beginning practitioners in the field. This book shows that data visualisation is a practice and discipline whose fluid boundaries continue to be moved in new, exciting, and unprecedented directions by emerging and seasoned designers alike.
What is data visualisation? In Data Visualization for Success, 40 designers and their works demonstrate that data visualisation is a vibrant and constantly evolving field that is as multimodal as it is interdisciplinary. Through the works showcased here, these designers discuss some of their approaches to working with data visualisation, offering insight into the design methods they commonly use and providing tips that will help beginning practitioners in the field. This book shows that data visualisation is a practice and discipline whose fluid boundaries continue to be moved in new, exciting, and unprecedented directions by emerging and seasoned designers alike.
Steven Braun holds a BA in Chemistry and Asian Studies from St Olaf College in Northfield, Minnesota, USA, and earned his MS in molecular biophysics and biochemistry at Yale University. He has been the data analytics and visualisation specialist with the Digital Scholarship Group in the Northeastern University Libraries (Boston, Massachusetts, USA) since November 2015. His experiences living and studying in Japan have deeply informed his general philosophy about data visualisation: visualisation is constructed space, where data are manifold and our choices in design directly inform how those data are interpreted and used.
| Erscheinungsdatum | 28.09.2017 |
|---|---|
| Zusatzinfo | 400 Illustrations, color |
| Verlagsort | Mulgrave, Victoria |
| Sprache | englisch |
| Maße | 210 x 300 mm |
| Gewicht | 1700 g |
| Themenwelt | Kunst / Musik / Theater ► Design / Innenarchitektur / Mode |
| Informatik ► Software Entwicklung ► User Interfaces (HCI) | |
| ISBN-10 | 1-86470-720-8 / 1864707208 |
| ISBN-13 | 978-1-86470-720-5 / 9781864707205 |
| Zustand | Neuware |
| Haben Sie eine Frage zum Produkt? |
Mehr entdecken
aus dem Bereich
aus dem Bereich
Aus- und Weiterbildung nach iSAQB-Standard zum Certified Professional …
Buch | Hardcover (2023)
dpunkt Verlag
CHF 48,85
Lean UX und Design Thinking: Teambasierte Entwicklung …
Buch | Hardcover (2022)
dpunkt (Verlag)
CHF 48,85
Wissensverarbeitung - Neuronale Netze
Buch | Hardcover (2023)
Carl Hanser (Verlag)
CHF 48,95


