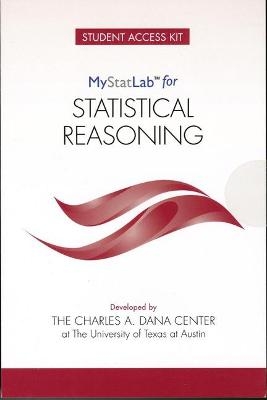
MyLab Statistics for Statistical Reasoning -- Student Access Kit
Pearson (Hersteller)
978-0-13-439165-6 (ISBN)
- Keine Verlagsinformationen verfügbar
- Artikel merken
MyStatLab for Statistical Reasoning is part of the series of MyMathLab/MyStatLab courses built to support the New Mathways Project developed by the Charles A. Dana Center. The New Mathways Project embodies the Dana Center’s vision for a systemic approach to improving student success and completion through implementation of processes, strategies, and structures built around three mathematics pathways and a supporting student success course.MyStatLab for Statistical Reasoning is the college-level course in the Statistics pathway for non-STEM students, designed with an active-learning approach that connects statistical concepts to hands-on and discovery-based activities for students. The MyStatLab course designed for use with Statistical Reasoning provides:
Interactive content to help prepare students for active classroom time
In-Class Interactive Lessons to support students through an active classroom experience, accompanied by notebook PDFs.
Homework assignments designed to assess conceptual understanding of important skills and concepts.
Additional resources for instructors to help facilitate an interactive and engaging classroom
Built in MyStatLab
Content developed by the Charles A. Dana Center at The University of Texas at Austin will be delivered through MyStatLab. MyStatLab is an online homework, tutorial, and assessment program that engages students and improves results. Within its structured environment, students practice what they learn, test their understanding, and pursue a personalized study plan that helps them absorb course material and understand difficult concepts.
MyStatLab for Statistical Reasoning was developed by the Charles A. Dana Center at The University of Texas—Austin. The Dana Center brings together experienced faculty from two- and four-year institutions to author, review, field-test, and revise the New Mathways Project curricular materials. The Dana Center develops and scales effective math and science innovations to support educators, administrators, and policy makers in creating seamless transitions throughout the K14 system for all students. Their work, based on research and two decades of experience, focuses on K—16 mathematics and science education with an emphasis on strategies for improving student engagement, motivation, persistence, and achievement. They develop innovative curricula, tools, protocols, and instructional supports and deliver powerful instructional and leadership development.
Curriculum Overview
Before the Semester Begins: Suggestions for Prep Week
Lesson 1: Introduction to Statistics
1.A: Birth Dates and Personality Traits
1.B: Our Learning Community
1.C: Statistical Investigations
1.D: The Statistical Analysis Process
1.E: Types of Statistical Studies and Scope of Conclusions
Lesson 2: Sampling
2.A: Collecting Data by Sampling
2.B: Random Sampling
2.C: Other Sampling Methods (Optional)
2.D: Sources of Bias in Sampling
Lesson 3: Experiments
3.A: Planning an Experiment
3.B: Random Assignment
3.C: Control Groups and Placebos
3.D: Drawing Conclusions from Statistical Studies
3.E: Forming Effective Study Groups
Lesson 4: Univariate Data Displays and Measures of Center
4.A: Dotplots for Quantitative Data
4.B: Constructing Histograms for Quantitative Data
4.C: Weight Gain
4.D: Dotplots, Histograms, and Distributions
Lesson 5: Variability
5.A: Variability Relative to the Mean
5.B: Boxplots
5.C: The Modified Boxplot
5.D: Do the Parties Differ?
Lesson 6: Scatterplots and Correlation
6.A: Introduction to Two-Variable Relationships
6.B: Direction and Strength of the Relationship
6.C: Correlation Coefficient
6.D: Correlation and Cause-and-Effect Conclusions
Lesson 7: Lines of Best Fit
7.A: Using Lines to Make Predictions
7.B: Exploring Lines of Best Fit
7.C: Least Squares Regression (LSR) Line
7.D: Impact of Outliers on Correlations and Regression
Lesson 8: Least Squares Regression Line
8.A: Investigating the Numbers in a Line’s Equation
8.B: Building the LSR Line’s Equation (Optional)
8.C: Determining If a Line Is a Good Fit
8.D: Determining If a Line Is an Appropriate Model
Lesson 9: Bivariate Categorical Data
9.A: Categorical Data and Two-Way Tables
9.B: Comparative Bar Charts
9.C: Case Study
Lesson 10: Probability
10.A: Introduction to Probability
10.B: Study on Blood Pressure
10.C: Probability Rules
10.D: Conditional Probability and Independence
10.E: The Multiplication and Addition Rules
Lesson 11: Probability Distributions
11.A: Simulation
11.B: Probability Distributions of Discrete Random Variables
11.C: Probability Distributions of Continuous Random Variables
11.D: Constructing Probability Distributions
Lesson 12: The Normal Distribution
12.A: The Normal Distribution
12.B: z-Scores and Normal Distributions
12.C: Probability and Critical Values
12.D: Probability and Critical Values (continued)
Lesson 13: Sampling Variability
13.A: Sampling Variability
13.B: What Is a Sampling Distribution?
13.C: The Sampling Distribution of a Sample Proportion
13.D: Effect of Sample Size and the Value of the Population Proportion
13.E: The Standard Error
Lesson 14: Estimating a Population Proportion
14.A: Estimating a Population Proportion
14.B: Calculating a Margin of Error
14.C: Evaluating a Claim–Part 1
14.D: Evaluating a Claim–Part 2
Lesson 15: Confidence Intervals for a Population Proportion
15.A: Confidence Intervals and Confidence Levels
15.B.A: Confidence Interval for a Population Proportion
15.C: Interpreting Confidence Intervals and Margin of Error
Lesson 16: Hypothesis Testing About a Population Proportion
16.A: The Logic of Hypothesis Testing
16.B: Steps in Hypothesis Testing
16.C: Testing Hypotheses About a Population Proportion–Part 1
16.D: Testing Hypotheses About a Population Proportion–Part 2
Lesson 17: Sampling Distribution of a Sample Mean
17.A: Sampling Distribution of a Sample Mean
17.B: Effect of Sample Size and Variability in the Population
17.C: General Properties of the Sampling Distribution of a Sample Mean
Lesson 18: Inference About a Population Mean
18.A: t-Distributions
18.B: One Sample Confidence Interval for a Population Mean–Part 1
18.C: One Sample Confidence Interval for a Population Mean–Part 2
18.D: One Sample Hypothesis Test for a Population Mean–Part 1
18.E: One Sample Hypothesis Test for a Population Mean–Part 2
Lesson 19: Comparing Two Populations
19.A: Hypotheses About a Difference in Population Means or Proportions
19.B: Two-Sample Test for a Difference in Population Proportions
19.C: Paired Versus Independent Samples
19.D: Two-Sample Test for a Difference in Population Means Using Independent Samples
19.E: Inference for Paired Samples
19.F: Two-Sample Confidence Interval for a Difference in Population Proportions
19.G: Two-Sample Confidence Interval for a Difference in Population Means
Lesson 20: Analysis of Categorical Data: Chi-Square Goodness of Fit (Optional)
20.A: Quantifying the Strength of the Evidence
20.B: Conducting the Chi-Square Test
20.C: The Chi-Square Test and Degrees of Freedom
Lesson 21: Analysis of Categorical Data: Chi-Square Tests for Two-Way Tables (Optional)
21.A: Introduction to Chi-Square Tests for Two-Way Tables
21.B: Chi-Square Test for Independence
21.C: Chi-Square Test for Homogeneity
Lesson 22: Inference for Regression (Optional)
22.A: Sampling Distributions of Sample Slopes
22.B: Confidence Intervals for a Population Slope
22.C: Testing Claims About a Population Slope
Lesson 23: One-Way Analysis of Variance (Optional)
23.A: One-Way Analysis of Variance–Equal Sample Sizes
23.B: One-Way Analysis of Variance–Unequal Sample Sizes
23.C: Interpreting a One-Way Analysis of Variance
Answers (Odd)
Resources
5-Number Summary and Boxplots
Categorical Data
The Chi-Square (χ2) Distribution
The Chi-Square (χ2) Goodness-of-Fit Test
The Chi-Square (χ2) Test for Homogeneity
The Chi-Square (χ2) Test for Independence
Confidence Intervals for Means
Confidence Intervals for Proportions
Experimental Studies
Fractions, Decimals, and Percentages
Hypothesis Testing for Means
Hypothesis Testing for Proportions
Inference for Regression
Introduction to Statistical Studies
Mean, Mode, and Median
The Normal Distribution
One-Way Analysis of Variance
Probability Rules
Sampling Methods
t-Distributions
Technology: Summary Statistics and LSR Line
Variance and Standard Deviation
Writing Principles
Glossary
| Erscheint lt. Verlag | 13.8.2018 |
|---|---|
| Reihe/Serie | Dana Center Mathematics Pathways |
| Sprache | englisch |
| Maße | 216 x 279 mm |
| Gewicht | 14 g |
| Themenwelt | Mathematik / Informatik ► Mathematik ► Statistik |
| ISBN-10 | 0-13-439165-9 / 0134391659 |
| ISBN-13 | 978-0-13-439165-6 / 9780134391656 |
| Zustand | Neuware |
| Informationen gemäß Produktsicherheitsverordnung (GPSR) | |
| Haben Sie eine Frage zum Produkt? |
aus dem Bereich
