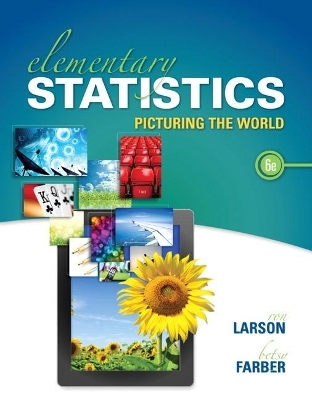
Elementary Statistics
Pearson
978-0-321-91121-6 (ISBN)
- Titel erscheint in neuer Auflage
- Artikel merken
Ron Larson received his Ph.D. in mathematics from the University of Colorado in 1970. At that time he accepted a position with Penn State University, and he currently holds the rank of professor of mathematics at the university. Larson is the lead author of more than two dozen mathematics textbooks that range from sixth grade through calculus levels. Many of his texts, such as the tenth edition of his calculus text, are leaders in their markets. Larson is also one of the pioneers in the use of multimedia and the Internet to enhance the learning of mathematics. He has authored multimedia programs, extending from the elementary school through calculus levels. Larson is a member of several professional groups and is a frequent speaker at national and regional mathematics meetings. Betsy Farber received her Bachelor’s degree in mathematics from Penn State University and her Master’s degree in mathematics from the College of New Jersey. Since 1976, she has been teaching all levels of mathematics at Bucks County Community College in Newtown, Pennsylvania, where she currently holds the rank of professor. She is particularly interested in developing new ways to make statistics relevant and interesting to her students and has been teaching statistics in many different modes—with the TI-84 Plus, with MINITAB, and by distance learning as well as in the traditional classroom. A member of the American Mathematical Association of Two-Year Colleges (AMATYC), she is an author of The Student Edition of MINITAB and A Guide to MINITAB. She served as consulting editor for Statistics: A First Course and has written computer tutorials for the CD-ROM correlating to the texts in the Street Series in mathematics.
PART ONE. DESCRIPTIVE STATISTICS
1. Introduction to Statistics
1.1. An Overview of Statistics
1.2. Data Classification
Case Study: Rating Television Shows in the
United States
1.3. Data Collection and Experimental Design
Activity: Random Numbers
Uses and Abuses
Chapter Summary
Review Exercises
Chapter Quiz
Chapter Test
Real Statistics-Real Decisions-Putting It All Together
History of Statistics-Timeline
Technology: Using Technology in Statistics
2. Descriptive Statistics
2.1. Frequency Distributions and Their Graphs
2.2. More Graphs and Displays
2.3. Measures of Central Tendency
Activity: Mean Versus Median
2.4. Measures of Variation
Activity: Standard Deviation
Case Study: Business Size
2.5. Measures of Position
Uses and Abuses
Chapter Summary
Review Exercises
Chapter Quiz
Chapter Test
Real Statistics-Real Decisions-Putting It All Together
Technology: Parking Tickets
Using Technology to Determine Descriptive
Statistics
Cumulative Review: Chapters 1 and 2
PART TWO. PROBABILITY & PROBABILITY DISTRIBUTIONS
3. Probability
3.1. Basic Concepts of Probability and Counting
Activity: Simulating the Stock Market
3.2. Conditional Probability and the Multiplication Rule
3.3. The Addition Rule
Activity: Simulating the Probability of Rolling a 3 or 4
Case Study: United States Congress
3.4. Additional Topics in Probability and Counting
Uses and Abuses
Chapter Summary
Review Exercises
Chapter Quiz
Chapter Test
Real Statistics-Real Decisions-Putting It All Together
Technology: Simulation: Composing Mozart
Variations with Dice
4. Discrete Probability Distributions
4.1. Probability Distributions
4.2. Binomial Distributions
Activity: Binomial Distribution
Case Study: Distribution of Number of Hits in
Baseball Games
4.3. More Discrete Probability Distributions
Uses and Abuses
Chapter Summary
Review Exercises
Chapter Quiz
Chapter Test
Real Statistics-Real Decisions-Putting It All Together
Technology: Simulation: Using Poisson
Distributions as Queuing Models
5. Normal Probability Distributions
5.1. Introduction to Normal Distributions and the Standard Normal Distribution
5.2. Normal Distributions: Finding Probabilities
5.3. Normal Distributions: Finding Values
Case Study: Birth Rates in America
5.4. Sampling Distributions and the Central Limit Theorem
Activity: Sampling Distributions
5.5. Normal Approximations to Binomial Distributions
Uses and Abuses
Chapter Summary
Review Exercises
Chapter Quiz
Chapter Test
Real Statistics-Real Decisions-Putting It All Together
Technology: Simulation: Age Distribution in the
United States
Cumulative Review: Chapters 3 to 5
PART THREE. STATISTICAL INFERENCE
6. Confidence Intervals
6.1. Confidence Intervals for the Mean (¡ Known)
6.2. Confidence Intervals for the Mean (¡ Unknown)
Activity: Confidence Intervals for a Mean
Case Study: Marathon Training
6.3. Confidence Intervals for Population Proportions
Activity: Confidence Intervals for a Proportion
6.4. Confidence Intervals for Variance and Standard Deviation
Uses and Abuses
Chapter Summary
Review Exercises
Chapter Quiz
Chapter Test
Real Statistics-Real Decisions-Putting It All Together
Technology: Simulation: Most Admired Polls
Using Technology to Construct Confidence
Intervals
7. Hypothesis Testing with One Sample
7.1. Introduction to Hypothesis Testing
7.2. Hypothesis Testing for the Mean (¡ Known)
7.3. Hypothesis Testing for the Mean (¡ Unknown)
Activity: Hypothesis Test for a Mean
Case Study: Human Body Temperature: What's
Normal?
7.4. Hypothesis Testing for Proportions
Activity: Hypothesis Test for a Proportion
7.5. Hypothesis Testing for Variance and Standard Deviation
A Summary of Hypothesis Testing
Uses and Abuses
Chapter Summary
Review Exercises
Chapter Quiz
Chapter Test
Real Statistics-Real Decisions-Putting It All Together
Technology: The Case of the Vanishing Women
Using Technology to Perform Hypothesis Tests
8. Hypothesis Testing with Two Samples
8.1. Testing the Difference Between Means (Independent Samples, ¡1 and ¡2 Known)
8.2. Testing the Difference Between Means (Independent Samples, ¡1 and ¡2 Unknown)
8.3. Testing the Difference Between Means (Dependent Samples)
8.4. Testing the Difference Between Proportions
A Summary of Hypothesis Testing
Uses and Abuses
Chapter Summary
Review Exercises
Chapter Quiz
Chapter Test
Real Statistics-Real Decisions-Putting It All Together
Technology: Tails over Heads
Using Technology to Perform Two-Sample
Hypothesis Tests
Cumulative Review: Chapters 6 to 8
PART FOUR. MORE STATISTICAL INFERENCE
9. Correlation and Regression
9.1 Correlation
Activity: Correlation by Eye
9.2. Linear Regression
Activity: Regression by Eye
Case Study: Correlation by Body Measurements
9.3. Measures of Regression and Prediction Intervals
9.4. Multiple Regression
A Summary of Hypothesis Testing
Uses and Abuses
Chapter Summary
Review Exercises
Chapter Quiz
Chapter Test
Real Statistics-Real Decisions-Putting It All Together
Technology: Nutrients in Breakfast Cereals
10. Chi-Square Tests and the F-Distribution
10.1. Goodness-of-Fit Test
10.2. Independence
Case Study: Food Safety Survey
10.3. Comparing Two Variances
10.4. Analysis of Variance
Uses and Abuses
Chapter Summary
Review Exercises
Chapter Quiz
Chapter Test
Real Statistics-Real Decisions-Putting It All Together
Technology: Teacher Salaries
Cumulative Review: Chapters 9 and 10
11. Nonparametric Tests
(Online Only: Download from MyStatLab or www.pearsonhighered.com/mathstatsresources)
11.1. The Sign Test
11.2. The Wilcoxon Tests
Case Study: College Ranks
11.3. The Kruskal-Wallis Test
11.4. Rank Correlation
11.5. The Runs Test
Uses and Abuses
Chapter Summary
Review Exercises
Chapter Quiz
Chapter Test
Real Statistics-Real Decisions-Putting It All Together
Technology: U.S. Income and Economic
Research
| Erscheint lt. Verlag | 6.6.2014 |
|---|---|
| Sprache | englisch |
| Maße | 10 x 10 mm |
| Gewicht | 1630 g |
| Themenwelt | Mathematik / Informatik ► Mathematik ► Statistik |
| ISBN-10 | 0-321-91121-0 / 0321911210 |
| ISBN-13 | 978-0-321-91121-6 / 9780321911216 |
| Zustand | Neuware |
| Haben Sie eine Frage zum Produkt? |
aus dem Bereich


