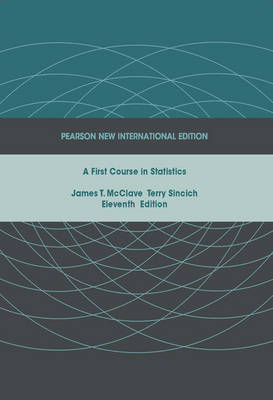
First Course in Statistics, A: Pearson New International Edition
Pearson Education Limited
978-1-292-02366-3 (ISBN)
- Titel erscheint in neuer Auflage
- Artikel merken
The Eleventh Edition infuses a new focus on ethics, which is critically important when working with statistical data. Chapter Summaries have a new, study-oriented design, helping students stay focused when preparing for exams. Data, exercises, technology support, and Statistics in Action cases are updated throughout the book. In addition, MyStatLab will have increased exercise coverage and two new banks of questions to draw from: Getting Ready for Stats and Conceptual Question Library.
Ideal for one- or two-semester courses in introductory statistics, this text assumes a mathematical background of basic algebra. Flexibility is built in for instructors who teach a more advanced course, with optional footnotes about calculus and the underlying theory.
1. Statistics, Data, and Statistical Thinking
1.1 The Science of Statistics
1.2 Types of Statistical Applications
1.3 Fundamental Elements of Statistics
1.4 Types of Data
1.5 Collecting Data
1.6 The Role of Statistics in Critical Thinking
2. Methods for Describing Sets of Data
2.1 Describing Qualitative Data
2.2 Graphical Methods for Describing Quantitative Data
2.3 Summation Notation
2.4 Numerical Measures of Central Tendency
2.5 Numerical Measures of Variability
2.6 Interpreting the Standard Deviation
2.7 Numerical Measures of Relative Standing
2.8 Methods for Detecting Outliers: Box Plots and z-Scores
2.9 Graphing Bivariate Relationships (Optional)
2.10 Distorting the Truth with Descriptive Techniques
3. Probability
3.1 Events, Sample Spaces, and Probability
3.2 Unions and Intersections
3.3 Complementary Events
3.4 The Additive Rule and Mutually Exclusive Events
3.5 Conditional Probability
3.6 The Multiplicative Rule and Independent Events
3.7 Random Sampling
3.8 Some Additional Counting Rules (Optional)
3.9 Bayes' Rule (Optional)
4. Random Variables and Probability Distributions
4.1 Two Types of Random Variables
4.2 Probability Distributions for Discrete Random Variables
4.3 Expected Values of Discrete Random Variables
4.4 The Binomial Random Variable
4.5 Continuous Probability Distributions
4.6 The Normal Distribution
4.7 Descriptive Methods for Assessing Normality
4.8 Approximating a Binomial Distribution with a Normal Distribution (Optional)
4.9 What is a Sampling Distribution?
4.10 The Sampling Distribution of (x-bar) and the Central Limit Theorem
5. Inferences Based on a Single Sample: Estimation with Confidence Intervals
5.1 Identifying and Estimating the Target Parameter
5.2 Confidence Interval for a Population Mean: Normal (z) Statistic
5.3 Confidence Interval for a Population Mean: Student's t-statistic
5.4 Large-Sample Confidence Interval for a Population Proportion
5.5 Determining the Sample Size
5.6 Confidence Interval for a Population Variance (Optional)
6. Inferences Based on a Single Sample: Tests of Hypothesis
6.1 The Elements of a Test of Hypothesis
6.2 Formulating Hypotheses and Setting Up the Rejection Region
6.3 Test of Hypothesis About a Population Mean: Normal (z) Statistic
6.4 Observed Significance Levels: p-Values
6.5 Test of Hypothesis About a Population Mean: Student's t-statistic
6.6 Large-Sample Test of Hypothesis About a Population Proportion
6.7 Calculating Type II Error Probabilities: More About ss (Optional)
6.8 Test of Hypothesis About a Population Variance (Optional)
6.9 Single Population Inferences
7. Comparing Population Means
7.1 Identifying the Target Parameter
7.2 Comparing Two Population Means: Independent Sampling
7.3 Comparing Two Population Means: Paired Difference Experiments
7.4 Determining the Sample Size
7.5 The Completely Randomized Design: Single Factor
7.6 Comparing Two Populations: Independent Samples
7.7 Comparing Two Populations: Paired Difference Experiment
8. Comparing Population Proportions
8.1 Categorical Data and the Multinomial Distribution
8.2 Testing Categorical Probabilities: One-Way Table
8.3 Testing Categorical Probabilities: Two-Way (Contingency) Table
8.4 A Word of Caution About Chi-Square Tests
8.5 Comparing Two Population Proportions: Independent Sampling
8.6 Determining the Sample Size
9. Simple Linear Regression
9.1 Probabilistic Models
9.2 Fitting the Model: The Least Squares Approach
9.3 Model Assumptions
9.4 Assessing the Utility of the Model: Making Inferences About the Slope ss1
9.5 The Coefficients of Correlation and Determination
9.6 Using the Model for Estimation and Prediction
9.7 A Complete Example
9.8 Rank Correlation
| Erscheint lt. Verlag | 2.8.2013 |
|---|---|
| Verlagsort | Harlow |
| Sprache | englisch |
| Maße | 219 x 278 mm |
| Gewicht | 1258 g |
| Themenwelt | Mathematik / Informatik ► Mathematik ► Statistik |
| ISBN-10 | 1-292-02366-X / 129202366X |
| ISBN-13 | 978-1-292-02366-3 / 9781292023663 |
| Zustand | Neuware |
| Haben Sie eine Frage zum Produkt? |
aus dem Bereich


