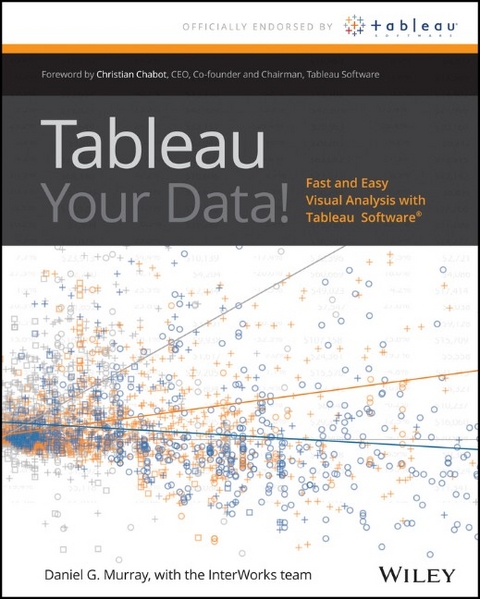
Tableau Your Data!
John Wiley & Sons Inc (Verlag)
978-1-118-61204-0 (ISBN)
- Titel ist leider vergriffen;
keine Neuauflage - Artikel merken
Best practices and step-by-step instructions for using the Tableau Software toolset Although the Tableau Desktop interface is relatively intuitive, this book goes beyond the simple mechanics of the interface to show best practices for creating effective visualizations for specific business intelligence objectives. It illustrates little-known features and techniques for getting the most from the Tableau toolset, supporting the needs of the business analysts who use the product as well as the data and IT managers who support it. This comprehensive guide covers the core feature set for data analytics, illustrating best practices for creating and sharing specific types of dynamic data visualizations. Featuring a helpful full-color layout, the book covers analyzing data with Tableau Desktop, sharing information with Tableau Server, understanding Tableau functions and calculations, and Use Cases for Tableau Software.
* Includes little-known, as well as more advanced features and techniques, using detailed, real-world case studies that the author has developed as part of his consulting and training practice * Explains why and how Tableau differs from traditional business information analysis tools * Shows you how to deploy dashboards and visualizations throughout the enterprise * Provides a detailed reference resource that is aimed at users of all skill levels * Depicts ways to leverage Tableau across the value chain in the enterprise through case studies that target common business requirements * Endorsed by Tableau Software Tableau Your Data shows you how to build dynamic, best-of-breed visualizations using the Tableau Software toolset.
Daniel G. Murray founded the Tableau/BI practice at InterWorks, Inc., one of Tableau's trusted professional services partners. He was selected to write this book by Tableau Software, reflecting InterWorks' leading position in consulting and training on Tableau Software.
Foreword xix Introduction xxi Part I Desktop 1 1 Creating Visual Analytics with Tableau Desktop 3 2 Connecting to Your Data 35 3 Building Your First Visualization 65 4 Creating Calculations to Enhance Your Data 109 5 Using Maps to Improve Insight 137 6 Developing an Ad Hoc Analysis Environment 161 7 Tips, Tricks, and Timesavers 177 8 Bringing It All Together with Dashboards 211 Part II Tableau Server 281 9 Installing Tableau Server 283 10 Using Tableau Server to Facilitate Fact-Based Team Collaboration 317 11 Automating Server with Tableau s Command Line Tools 357 Part III Case Studies 371 12 Use Cases for Rapid-Fire Visual Analytics 373 Part IV Appendices 393 A Understanding and Using Tableau Functions 395 B Tableau Data Shaper Excel Plug-In 475 C Companion Website 479 D Glossary 481 Index 493
| Vorwort | Christian Chabot |
|---|---|
| Zusatzinfo | illustrations (colour) |
| Verlagsort | New York |
| Sprache | englisch |
| Maße | 188 x 232 mm |
| Gewicht | 1242 g |
| Themenwelt | Mathematik / Informatik ► Informatik ► Datenbanken |
| Mathematik / Informatik ► Informatik ► Programmiersprachen / -werkzeuge | |
| Mathematik / Informatik ► Informatik ► Theorie / Studium | |
| Mathematik / Informatik ► Mathematik ► Wahrscheinlichkeit / Kombinatorik | |
| ISBN-10 | 1-118-61204-3 / 1118612043 |
| ISBN-13 | 978-1-118-61204-0 / 9781118612040 |
| Zustand | Neuware |
| Informationen gemäß Produktsicherheitsverordnung (GPSR) | |
| Haben Sie eine Frage zum Produkt? |
aus dem Bereich


