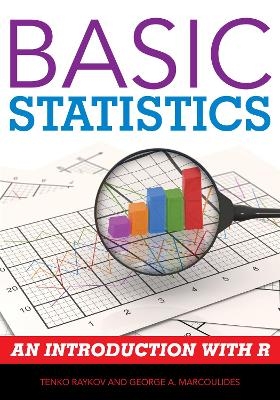
Basic Statistics
Rowman & Littlefield (Verlag)
978-1-4422-1847-5 (ISBN)
Basic Statistics provides an accessible and comprehensive introduction to statistics using the free, state-of-the-art, powerful software program R. This book is designed to both introduce students to key concepts in statistics and to provide simple instructions for using R.
This concise book:
·Teaches essential concepts in statistics, assuming little background knowledge on the part of the reader
·Introduces students to R with as few sub-commands as possible for ease of use
·Provides practical examples from the educational, behavioral, and social sciences
With clear explanations of statistical processes and step-by-step commands in R, Basic Statistics will appeal to students and professionals across the social and behavioral sciences.
Tenko Raykov is professor of measurement and quantitative methods at Michigan State University. George A. Marcoulides is professor of research methods and statistics at the University of California, Riverside.
Preface
1. Statistics and data.
1.1.Statistics as a science.
1.2.Collecting data.
1.3.Why study statistics?
2. An introduction to descriptive statistics: Data description and graphical
representation.
2.1. What is descriptive statistics?
2.2. Graphical means of data description.
2.2.1. Reading data into R.
2.2.2. Graphical representation of data.
2.2.2.1. Pie-charts and bar-plots.
2.2.2.2. Histograms and stem-and-leaf plots.
3. Data description: Measures of central tendency and variability.
3.1. Measures of central tendency.
3.1.1. The mode.
3.1.2. The median.
3.1.3. The mean.
3.2. Measures of variability.
3.3. The box-plot.
3.3.1. Quartiles.
3.3.2. Definition and empirical construction of a box-plot.
3.3.3. Box-plots and comparison of groups of scores.
4. Probability.
4.1. Why be interested in probability?
4.2. Definition of probability.
4.2.1. Classical definition.
4.2.2. Relative frequency definition.
4.2.3. Subjective definition.
4.3. Evaluation of event probability.
4.4. Basic relations between events and their probabilities.
4.5. Conditional probability and independence.
4.5.1. Defining conditional probability.
4.5.2. Event independence.
4.6. Bayes’ formula (Bayes’ theorem).
5. Probability distributions of random variables.
5.1. Random variables.
5.2. Probability distributions for discrete random variables.
5.2.1. A start up example.
5.2.2. The binomial distribution.
5.2.3. The Poisson distribution.
5.3. Probability distributions for continuous random variables.
5.3.1. The normal distribution.
5.3.1.1. Definition.
5.3.1.2. Graphing a normal distribution.
5.3.1.3. Mean and variance of a normal distribution.
5.3.1.4. The standard normal distribution.
5.3.2. z-scores.
5.3.3. Model of congeneric tests.
5.4. The normal distribution and areas under the normal density curve.
5.5. Percentiles of the normal distribution.
6. Random sampling distributions and the central limit theorem.
6.1. Random sampling distribution.
6.1.1. Random sample.
6.1.2. Sampling distribution.
6.2. The random sampling distribution of the mean (sample average).
6.2.1. Mean and variance of the RSD of the sample average.
6.2.2. Standard error of the mean.
6.3. The central limit theorem.
6.3.1. The central limit theorem as a large-sample statement.
6.3.2. When does normality hold for a finite sample?
6.3.3. How large a sample size is ‘sufficient’ for the central limit theorem
to be valid?
6.3.4. Central limit theorem for sums of random variables.
6.3.5. A revisit of the random sampling distribution concept.
6.3.6. An application of the central limit theorem.
6.4. Assessing the normality assumption for a population distribution.
7. Inferences about single population means.
7.1. Population parameters.
7.2. Parameter estimation and hypothesis testing.
7.3. Point and interval estimation of the mean.
7.3.1. Point estimation.
7.3.2. Interval estimation.
7.3.3. Standard normal distribution quantiles for use in confidence
intervals.
7.3.4. How good is an estimate, and what affects the width of a confidence
interval?
7.4. Choosing sample size for estimating the mean.
7.5. Testing hypotheses about population means.
7.5.1. Statistical testing, hypotheses, and test statistics.
7.5.2. Rejection regions.
7.5.3. The ‘assumption’ of statistical hypothesis testing
7.5.4. A general form of a z-test.
7.5.5. Significance level.
7.6. Two types of error in statistical hypothesis testing.
7.6.1. Type I and Type II errors.
7.6.2. Statistical power.
7.6.3. Type I error rate and significance level.
7.6.4. Have we proved the null or alternative hypothesis?
7.6.5. One-tailed tests.
7.6.5.1. Alternative hypothesis of mean larger than a pre-specified
number.
7.6.5.2. Alternative hypothesis of mean smaller than a pre-specified
number.
7.6.5.3. Advantages and drawbacks of one-tailed tests.
7.6.5.4. Extensions to one-tailed null hypotheses.
7.6.5.5. One- and two-tailed tests at other significance levels.
7.7. The concept of p-value.
7.8. Hypothesis testing using a confidence interval.
8. Inferences about population means when variances are unknown.
8.1. The t-ratio and t-distribution.
8.1.1. Degrees of freedom.
8.1.2. Properties of the t-distribution.
8.2. Hypothesis testing about the mean with unknown standard deviation.
8.2.1. Percentiles of the t-distribution.
8.2.2. Confidence interval and testing hypotheses about a given population
mean.
8.2.3. One-tailed t-tests.
8.2.4. Inference for a single mean at another significance level.
8.3. Inferences about differences of two independent means.
8.3.1. Point and interval estimation of the difference in two independent
population means.
8.3.2. Hypothesis testing about the difference in two independent
population means.
8.3.3. The case of unequal variances.
8.4. Inferences about mean differences for related samples.
9. Inferences about population variances.
9.1. Estimation and testing of hypotheses about a single population variance.
9.1.1. Variance estimation.
9.1.2. The random sampling distribution of the sample variance.
9.2.3. Percentiles of the chi-square distribution.
9.1.4. Confidence interval for the population variance.
9.1.5. Testing hypotheses about a single variance
9.2. Inferences about two independent population variances.
9.2.1. The F-distribution.
9.2.2. Percentiles of the F-distribution.
9.3.3. Confidence interval for the ratio of two independent population
variances
10. Analysis of categorical data.
10.1. Inferences about a population probability (proportion).
10.2. Inferences about the difference between two population probabilities
(proportions)
10.3. Inferences about several proportions.
10.3.1. The multinomial distribution.
10.3.2. Testing hypotheses about multinomial probabilities.
10.4. Testing categorical variable independence in contingency tables.
10.4.1. Contingency tables.
10.4.2. Joint and marginal distributions.
10.4.3. Testing variable independence.
11. Correlation.
11.1. Relationship between a pair of random variables.
11.2. Graphical trend of variable association.
11.3. The covariance coefficient.
11.4. The correlation coefficient.
11.5. Linear transformation invariance of the correlation coefficient.
11.6. Is there a discernible linear relationship pattern between two variables in a
studied population?
11.7. Cautions when interpreting a correlation coefficient.
12. Simple linear regression.
12.1. Dependent and independent variables.
12.2. Intercept and slope.
12.3. Estimation of model parameters (model fitting).
12.4. How good is the simple regression model?
12.4.1. Model residuals and the standard error of estimate.
12.4.2. The coefficient of determination.
12.5. Inferences about model parameters and the coefficient of
determination.
12.6. Evaluation of model assumptions, and modifications.
12.6.1. Assessing linear regression model assumptions via residual plots.
12.6.2. Model modification suggested by residual plots.
13. Multiple regression.
13.1. Multiple regression model, multiple correlation, and coefficient of
determination.
13.2. Inferences about parameters and model explanatory power.
13.2.1. A test of significance for the coefficient of determination.
13.2.2. Testing single regression coefficients for significance.
13.2.3. Confidence interval for a regression coefficient.
13.3. Adjusted R2 and shrinkage.
13.4. The multiple F-test and evaluation of change in proportion of explained
variance following dropping or addition of predictors.
13.5. Strategies for predictor selection.
13.5.1. Forward selection.
13.5.2. Backward elimination.
13.5.3. Stepwise selection (stepwise regression).
13.6. Analysis of residuals for multiple regression models.
14. Analysis of variance.
14.1. Hypotheses and factors.
14.2. Testing equality of population means.
14.3. Follow-up analyses.
14.4. Two-way and higher-order analysis of variance.
14.5. Relationship between analysis of variance and regression analysis.
14.6. Analysis of covariance.
15. Modeling discrete response variables.
15.1. Revisiting regression analysis and the general linear model.
15.2. The idea and elements of the generalized linear model.
15.3. Logistic regression as a generalized linear model of particular
relevance in social and behavioral research.
15.3.1. A ‘continuous counterpart’ of regression analysis.
15.3.2. Logistic regression - a generalized linear model with
a binary response.
15.3.3. Further generalized linear models.
15.4. Fitting logistic regression models using R.
Epilogue
References
| Verlagsort | Lanham, MD |
|---|---|
| Sprache | englisch |
| Maße | 176 x 250 mm |
| Gewicht | 708 g |
| Themenwelt | Geisteswissenschaften ► Psychologie |
| Mathematik / Informatik ► Mathematik ► Computerprogramme / Computeralgebra | |
| Mathematik / Informatik ► Mathematik ► Statistik | |
| Sozialwissenschaften ► Pädagogik | |
| Sozialwissenschaften ► Soziologie | |
| ISBN-10 | 1-4422-1847-9 / 1442218479 |
| ISBN-13 | 978-1-4422-1847-5 / 9781442218475 |
| Zustand | Neuware |
| Haben Sie eine Frage zum Produkt? |
aus dem Bereich


