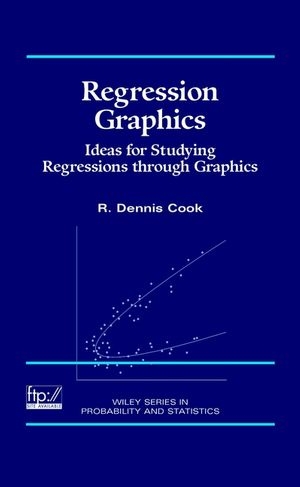
Regression Graphics
Wiley-Interscience (Verlag)
978-0-471-19365-4 (ISBN)
An exploration of regression graphics through computer graphics.
Recent developments in computer technology have stimulated new and exciting uses for graphics in statistical analyses. Regression Graphics, one of the first graduate-level textbooks on the subject, demonstrates how statisticians, both theoretical and applied, can use these exciting innovations. After developing a relatively new regression context that requires few scope-limiting conditions, Regression Graphics guides readers through the process of analyzing regressions graphically and assessing and selecting models. This innovative reference makes use of a wide range of graphical tools, including 2D and 3D scatterplots, 3D binary response plots, and scatterplot matrices. Supplemented by a companion ftp site, it features numerous data sets and applied examples that are used to elucidate the theory.
Other important features of this book include:
* Extensive coverage of a relatively new regression context based on dimension-reduction subspaces and sufficient summary plots
* Graphical regression, an iterative visualization process for constructing sufficient regression views
* Graphics for regressions with a binary response
* Graphics for model assessment, including residual plots
* Net-effects plots for assessing predictor contributions
* Graphics for predictor and response transformations
* Inverse regression methods
* Access to a Web site of supplemental plots, data sets, and 3D color displays.
An ideal text for students in graduate-level courses on statistical analysis, Regression Graphics is also an excellent reference for professional statisticians.
R. DENNIS COOK is Professor, Department of Applied Statistics, University of Minnesota. He is the coauthor of An Introduction to Regression Graphics and numerous articles on regression and experimental design. He received his PhD in statistics from Kansas State University and is a Fellow of the American Statistical Association and the Institute of Mathematical Statistics.
Introduction to 2D Scatterplots.
Constructing 3D Scatterplots.
Interpreting 3D Scatterplots.
Binary Response Variables.
Dimension-Reduction Subspaces.
Graphical Regression.
Getting Numerical Help.
Graphical Regression Studies.
Inverse Regression Graphics.
Sliced Inverse Regression.
Principles Hessian Directions.
Studying Predictor Effects.
Predictor Transformations.
Graphics for Model Assessment.
Bibliography.
Indexes.
| Erscheint lt. Verlag | 19.10.1998 |
|---|---|
| Reihe/Serie | Wiley Series in Probability and Statistics |
| Sprache | englisch |
| Maße | 163 x 245 mm |
| Gewicht | 667 g |
| Themenwelt | Geisteswissenschaften ► Psychologie ► Psychoanalyse / Tiefenpsychologie |
| Mathematik / Informatik ► Mathematik ► Wahrscheinlichkeit / Kombinatorik | |
| ISBN-10 | 0-471-19365-8 / 0471193658 |
| ISBN-13 | 978-0-471-19365-4 / 9780471193654 |
| Zustand | Neuware |
| Haben Sie eine Frage zum Produkt? |
aus dem Bereich


