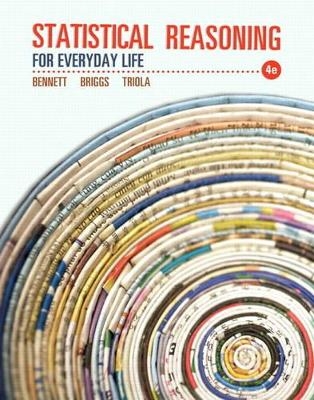
Statistical Reasoning for Everyday Life Plus NEW MyStatLab with Pearson eText -- Access Card Package
Pearson
978-0-321-89013-9 (ISBN)
- Titel erscheint in neuer Auflage
- Artikel merken
Packages
Access codes for Pearson's MyLab & Mastering products may not be included when purchasing or renting from companies other than Pearson; check with the seller before completing your purchase.
Used or rental books
If you rent or purchase a used book with an access code, the access code may have been redeemed previously and you may have to purchase a new access code.
Access codes
Access codes that are purchased from sellers other than Pearson carry a higher risk of being either the wrong ISBN or a previously redeemed code. Check with the seller prior to purchase.
--
Statistical Reasoning for Everyday Life, Fourth Edition, provides students with a clear understanding of statistical concepts and ideas so they can become better critical thinkers and decision makers, whether they decide to start a business, plan for their financial future, or just watch the news. The authors bring statistics to life by applying statistical concepts to the real world situations, taken from news sources, the internet, and individual experiences.
0321890132 / 9780321890139 Statistical Reasoning for Everyday Life Plus MyStatLab Student Code Card -- Access Card Package
Package consists of:
0321817621 / 9780321817624 Statistical Reasoning for Everyday Life
0321847997 / 9780321847997 My StatLab Glue-in Access Card
032184839X / 9780321848390 MyStatLab Inside Sticker for Glue-In Packages
Jeffrey Bennett specializes in mathematics and science education. In addition to his work in mathematics, Dr. Bennett (whose PhD is in astrophysics) has written leading college-level textbooks in mathematics, astronomy, statistics, and the new science of astrobiology, as well as books for the general public. He also proposed and developed both the Colorado Scale Model Solar System on the University of Colorado at Boulder campus and the Voyage Scale Model Solar System, a permanent, outdoor exhibit on the National Mall in Washington, DC. He has recently begun writing science books for children, including the award-winning Max Goes to the Moon and Max Goes to Mars. William L. Briggs has been on the mathematics faculty at the University of Colorado at Denver for 22 years. He developed the quantitative reasoning course for liberal arts students at the University of Colorado at Denver, supported by his textbook Using and Understanding Mathematics. He is a University of Colorado President's Teaching Scholar, an Outstanding Teacher awardee of the Rocky Mountain Section of the MAA, and the recipient of a Fulbright Fellowship to Ireland. Mario F. Triola is a Professor Emeritus of Mathematics at Dutchess Community College, where he taught statistics for more than 30 years. Marty is the author of Elementary Statistics, Elementary Statistics Using Excel, Elementary Statistics Using the TI-83/84 Plus Calculator, Essentials of Statistics, and a co-author of Biostatistics for the Biological and Health Sciences, Statistical Reasoning for Everyday Life, and Business Statistics. He has written several manuals and workbooks for technology supporting statistics education. The Text and Academic Authors Association has awarded Mario F. Triola a “Texty” for Excellence, for his work on Elementary Statistics.
Preface
Supplements
To the Student: How to Succeed in Your Statistics Course
Applications Index
1. Speaking of Statistics
1.1 What Is/Are Statistics?
1.2 Sampling
1.3 Types of Statistical Studies
1.4 Should You Believe a Statistical Study?
Focus on Psychology: Are You Driving "Drunk" on Your Cell Phone?
Focus on Public Health: Is Your Lifestyle Healthy?
2. Measurement in Statistics
2.1 Data Types and Levels of Measurement
2.2 Dealing with Errors
2.3 Uses of Percentages in Statistics
2.4 Index Numbers
Using Technology: Inflation Calculator
Focus on Politics: Who Benefited Most from Lower Tax Rates?
Focus on Economics: Can a Redefined CPI Help Solve the Budget Crisis?
3. Visual Displays of Data
3.1 Frequency Tables
Using Technology: Frequency Tables
3.2 Picturing Distributions of Data
Using Technology: Bar Graphs
Using Technology: Pie Charts
Using Technology: Line Charts and Histograms
3.3 Graphics in the Media
Using Technology: Graphs with Multiple Data Sets
3.4 A Few Cautions About Graphics
Focus on History: Can War Be Described with a Graph?
Focus on Environment: Are We Changing Earth's Atmosphere?
4. Describing Data
4.1 What Is Average?
Using Technology: Mean, Median, and Mode
4.2 Shapes of Distributions
4.3 Measures of Variation
Using Technology: Boxplots
Using Technology: Standard Deviation
4.4 Statistical Paradoxes
Focus on the Stock Market: What's Average About the Dow?
Focus on Economics: Are the Rich Getting Richer?
5. A Normal World
5.1 What Is Normal?
5.2 Properties of the Normal Distribution
Using Technology: Standard Scores in Excel
Using Technology: Standard Scores and Percentiles
5.3 The Central Limit Theorem
Focus on Education: What Can We Learn from SAT Trends?
Focus on Psychology: Are We Smarter than Our Parents?
6. Probability in Statistics
6.1 The Role of Probability in Statistics: Statistical Significance
6.2 Basics of Probability
6.3 The Law of Large Numbers
6.4 Ideas of Risk and Life Expectancy
6.5 Combining Probabilities (Supplementary Section)
Focus on Social Science: Do Lotteries Harm the Poor?
Focus on Law: Is DNA Fingerprinting Reliable?
7. Correlation and Causality
7.1 Seeking Correlation
Using Technology: Scatterplots and Correlation Coefficients
7.2 Interpreting Correlations
7.3 Best-Fit Lines and Prediction
7.4 The Search for Causality
Focus on Education: What Helps Children Learn to Read?
Focus on Environment: What Is Causing Global Warming?
8. From Samples to Populations
8.1 Sampling Distributions
8.2 Estimating Population Means
Using Technology: Confidence Interval Estimate of a Population Mean
8.3 Estimating Population Proportions
Using Technology: Confidence Interval Estimate of a Population
Proportion
Focus on History: Where Did Statistics Begin?
Focus on Literature: How Many Words Did Shakespeare Know?
9. Hypothesis Testing
9.1 Fundamentals of Hypothesis Testing
9.2 Hypothesis Tests for Population Means
Using Technology: Hypothesis Test for a Population Mean
9.3 Hypothesis Tests for Population Proportions
Using Technology: Hypothesis Test for a Population Proportion
Focus on Health and Education: Will Your Education Help You Live Longer?
Focus on Agriculture: Are Genetically Modified Foods Safe?
10. t Tests, Two-Way Tables, and ANOVA
10.1 t Distribution for Inferences about a Mean
Using Technology: The t Distribution
10.2 Hypothesis Testing with Two-Way Tables
Using Technology: Hypothesis Testing with Two-Way Tables
10.3 Analysis of Variance (One-Way Anova)
Using Technology: Analysis of Variance
Focus on Criminology: Can You Tell a Fraud When You See One?
Focus on Education: What Can a Fourth-Grader Do with Statistics?
Epilogue: A Perspective on Statistics
Appendix A: z-Score Tables
Appendix B: Table of Random Numbers
Suggested Readings
Credits
Glossary
Answers
Index
| Erscheint lt. Verlag | 28.2.2013 |
|---|---|
| Sprache | englisch |
| Themenwelt | Mathematik / Informatik ► Mathematik ► Statistik |
| ISBN-10 | 0-321-89013-2 / 0321890132 |
| ISBN-13 | 978-0-321-89013-9 / 9780321890139 |
| Zustand | Neuware |
| Haben Sie eine Frage zum Produkt? |
aus dem Bereich


